Altcoins Screener [SwissAlgo]Introduction: The Altcoins Screener at a Glance
The Altcoins Screener is a cryptocurrency analysis tool designed to provide an overview of potential trading opportunities across multiple crypto coins/tokens and categories. By combining technical analysis, price action assessment, and social metrics (via LunarCrush data), it presents market information and trading signals for a broad range of altcoins (approx. 300 USDT.P pairs of 9 crypto categories).
The screener is designed to consolidate market information onto a single chart , aiming to streamline the analysis of market conditions. It provides a consolidated market overview, which can simplify the assessment of market conditions, compared to monitoring individual charts with several layered indicators.
Key Features:
🔹 Multi-category analysis covering 300 crypto pairs of 9 categories on a single chart (Layer 1 & Top Coins, Layer2 & Scaling, Defi & Landing, Gaming & Metaverse, AI & Data, Exchanges & Trading, NFT & Social, Memes & Community, Other, User's Custom Portfolio).
🔹 Technical analysis with trade signals (Long/Short) based on an aggregated view of technical and social data points
🔹 Social sentiment integration through LunarCrush metrics (GalaxyScore, AltRank, Social Sentiment)
🔹 Real-time market scanning provides automated alerts when market conditions for specified coins/tokens potentially change.
🔹 Custom watchlist support for personalized monitoring (users can define a custom category containing a set of specific cryptocurrencies, i.e. own portfolio).
The screener presents data in a table format, using color-coded indicators to aid visual analysis. Detailed technical information is also provided. The assessments/trade signals provided by this indicator should be considered as one input among many when forming your trading strategy.
--------------------------------------
What It Does
The Altcoins Screener is a cryptocurrency analysis tool that offers:
Data Display and Analysis (Technical/Social):
🔹 Technical Metrics
* Technical Raw Data : Displays raw values for a range of technical indicators, including RSI, Stochastic RSI, DMI/ADX, RVI, ATR, OBV, and Hull Moving Averages (including their recent trends and potential significance).
Detailed view of key technical indicators, for further analysis and evaluation:
* Technical Analysis (Summary) : Provides a summarized interpretation of technical conditions based on aggregated parameters:
* Price Action
* Trend
* Momentum
* Volatility
* Volume
Summarized view of confluences for potential long/short bias:
🔹 Social Metrics (LunarCrush) : Presents data from LunarCrush®, including Galaxy Score®, AltRank®, and Social Sentiment® (including their recent trends and potential significance).
Lunarcrush data for the top 10 coins for each crypto category:
🔹 PVSRA (Price Volume & Market Makers Activity) Candles : Shows special candles highlighting potential market maker activity and volume anomalies, helping identify possible manipulation zones (including imbalance zones, i.e. price areas that market makers may revisit)
--------------------------------------
Key Features:
Automated trade signals (Long/Short) are generated based on algorithmic calculations and signal confidence levels across technical and social data points. These signals are intended to be used as one component of a broader trading strategy.
Custom sensitivity settings allow users to adjust the analysis timeframe (options: 1D, 2D, or 1W). Higher timeframes may provide a broader perspective, while the 2D setting is the default configuration.
Multi-category analysis covering a selection of approximately 300 crypto pairs across 9 predefined crypto categories.
Custom symbol selection: Users can define a custom list of up to 10 symbols for focused monitoring.
Automated Alerts to track potential trend changes across crypto categories (Long to Short to Neutral, or vice versa)
Visual Interface:
Organized table display with color-coded indicators to aid interpretation.
Clear and efficient format for scanning market information.
--------------------------------------
Target Audience
🔹 The screener is designed for cryptocurrency traders who:
Need to efficiently monitor multiple USDT perpetual futures markets
Use technical analysis in their trading decisions
Want to track sector-wide movements across crypto categories
🔹 Suitable for different trading styles:
Scalpers requiring quick market assessment
Swing traders analyzing multi-day trends
Position traders monitoring longer-term setups
The color-coded interface makes it accessible for intermediate traders while providing detailed metrics for advanced users. A basic understanding of technical analysis and crypto trading is recommended.
--------------------------------------
How It Works
The Altcoins Screener evaluates cryptocurrencies through a multi-layered analysis:
🔹 Core Analysis Components
Each parameter combines multiple indicators for comprehensive evaluation:
Price Action
EMA crossovers and momentum
Support/resistance zones
Candlestick patterns
Trend
Hull Moving Average system
DMI/ADX trend strength
Multi-timeframe confirmation
Momentum
RSI/Stochastic RSI readings
MACD convergence/divergence
Oscillator confirmations
Volatility
RVI/ATR measurements
Bollinger Bands behavior
Historical volatility trends
Volume
OBV trend analysis
Volume/price correlations
Volume profile assessment
🔹 Signal Generation Process
1. Real-time data collection across timeframes
2. Weighted indicator calculations
3. Parameter aggregation and analysis
4. Signal strength determination
5. Color-coding and alert generation
--------------------------------------
How to Use
🔹 Initial Setup:
Add the indicator to a chart (use the 1D timeframe)
Select your preferred crypto category or create a custom list
Choose between Technical Analysis or Technical Metrics view
Set data sensitivity based on your trading style
🔹 Using the Technical Analysis View:
Monitor color-coded dots for quick market assessment
Green: bullish conditions
Red: bearish conditions
Gray: neutral conditions
Check the "Trade Signal" column for potential Long/Short entries signaled by confluences among technical and/or social data points
🔹 Using the Technical Metrics View:
Review detailed numerical values
Monitor slopes (↑↓ arrows) for the most recent trend direction of each data point
Watch for pivotal points (highlighted cells): these are data points that suggest potential trend reversals
Focus on the confluence of multiple indicators
The technical metrics view corroborates the conclusions shown in the Technical Analysis View, providing more details about some critical data points.
🔹 Alert Configuration:
Enable Technical Alerts for signal notifications (which coin/token seems most suited for Long or Short trades, and which coin/token is in a neutral/uncertain state for trading = "No Trade")
Configure alert conditions based on trading style
Set timeframe-appropriate sensitivity
Monitor alert messages for trade signals
Instructions on how to set alerts are provided in the script (enable "Signals Setup Instructions" in User Interface to get a step-by-step guide about setting up alerts)
Best Practices:
Confirm signals across multiple timeframes
Use appropriate sensitivity for your trading style
Monitor multiple categories for sector rotation
Combine signals with your trading strategy
Verify signals with price action confirmation and deep dive into the charts of your potential targets
--------------------------------------
About the Settings
🔹 Crypto Category Selection
Layer 1 & Major: Top market cap coins (BTC, ETH, XRP,...), established protocols
Layer 2 & Scaling: ETH L2s, scaling solutions
DeFi & Lending: Decentralized finance protocols
Gaming & Metaverse: Gaming and virtual world tokens
AI & Data: Artificial intelligence and data projects
Exchange & Trading: Exchange tokens, trading protocols
NFT & Social: NFT platforms, social tokens
Memes & Community: Community-driven tokens
Others & Misc: Other categories
Custom Category: User-defined list (up to 10 symbols)
Data Type Options
Technical Analysis: Color-coded summary view
Technical Metrics: Detailed numerical values of some key technical data points
Sensitivity Settings
Higher: Shorter timeframe, more frequent signals
Default: Balanced timeframe, standard signals
Lower: Longer timeframe, stronger signals
Alert Settings
Technical Alerts: Trade signal notifications
Data Timeframe: Minimum 1D required
Theme: Dark/Light mode options
Note: All analysis is performed on USDT Perpetual Futures pairs from Binance
--------------------------------------
FAQ
Q: Does the screener work on other exchanges besides Binance?
A: No, it's designed specifically for Binance USDT Perpetual Futures pairs. Binance offers the highest liquidity and trading volume in the crypto derivatives market, making it ideal for technical analysis. The extensive range of trading pairs and reliable data streams help ensure more accurate signals and analysis. Using a single high-liquidity exchange also helps avoid inconsistencies that could arise from aggregating data across multiple platforms with varying liquidity levels.
Q: What's the minimum timeframe required?
A: The screener requires a minimum 1D (daily) timeframe. This requirement ensures that the technical analysis has sufficient data points for reliable signal generation. Lower timeframes can produce more noise and false signals, while daily timeframes help filter out market noise and identify stronger trends.
Q: Why are some social metrics showing "NaN"?
A: "NaN" (Not a Number) appears when cryptocurrencies don't have associated LunarCrush data. This typically occurs with newer tokens or those with lower market caps. The technical analysis remains fully functional regardless of social metric availability, as these are complementary data points.
Q: How often are signals updated?
A: Signals update with each new candle on the selected timeframe (1D, 2D, or 1W). For example, on the default 2D setting, signals are recalculated every two days as new candles form. This helps reduce noise while maintaining timely analysis of market conditions.
Q: Can I add spot trading pairs?
A: No, the screener is optimized for Binance USDT perpetual futures pairs for data consistency and analysis purposes. While spot and perpetual prices typically align closely due to arbitrage, using a single data source (Binance) and contract type (USDT perpetual) ensures uniform data quality and analysis across all pairs. This standardization helps maintain reliable technical analysis and signal generation.
Q: How many coins can I add to my custom list?
A: Users can add up to 10 custom symbols to their watchlist. This limit is designed to maintain optimal performance while allowing focused monitoring of specific assets. The custom list complements the predefined categories that cover over 300 pairs.
Q: What determines signal confidence levels?
A: Signal confidence is calculated through a weighted algorithm that considers multiple factors: trend strength (Hull MA, DMI/ADX), momentum indicators (RSI, SRSI), volatility measurements (RVI, ATR, BB), volume analysis (OBV, volume trends), and price action patterns. Higher confidence levels indicate stronger alignment across these factors.
Q: Are signals guaranteed to work?
A: No. Signals are analytical tools based on historical and current market data, not guaranteed predictions. They should be used as one component of a comprehensive trading strategy that includes proper risk management, position sizing, and additional confirmation factors. Past performance does not guarantee future results.
Q: Why does the screener need higher timeframes?
A: Higher timeframes (1D minimum) provide several benefits: reduced market noise, more reliable technical signals, better trend identification, and lower likelihood of false signals. They also align better with institutional trading patterns and allow for a more thorough analysis of market conditions across multiple indicators.
--------------------------------------
Conclusion
The Altcoins Screener is a comprehensive crypto market analysis tool that:
Scans 300+ cryptocurrencies across 9 sectors on a single chart
Combines technical indicators and social metrics for signal generation
Identifies potential trading opportunities through color-coded visuals
Saves time by eliminating the need to monitor multiple charts
The tool is suited for:
Market overview and sector rotation analysis
Quick assessment of market conditions
Technical and social sentiment tracking
Systematic trading approach with alerts
Use this screener with caution and as a complement to any other tool you use to define your trading strategy.
--------------------------------------
Disclaimer
This indicator is for informational and educational purposes only:
Not financial advice: This indicator should not be considered investment advice.
No guarantee of accuracy: The indicator's calculations and signals are based on specific algorithms and data sources, but accuracy cannot be guaranteed. Market conditions can change rapidly.
Past performance is not predictive: Past performance of the indicator's signals or any specific asset is not indicative of future results.
Substantial risk of loss: Trading cryptocurrencies involves a substantial risk of loss. You can lose money trading these assets.
User responsibility: Users are solely responsible for their own trading decisions and should exercise caution.
Independent research required: Always conduct thorough independent research (DYOR) before making any trading decisions.
Technical analysis is one of many tools: Technical analysis, including the output of this indicator, is just one tool among many and should not be relied upon exclusively.
Risk management is essential: Use proper risk management techniques, including position sizing and stop-loss orders.
Comprehensive strategy: Use this tool as part of a comprehensive trading strategy, not as a standalone solution.
No liability for trading results: The Author assumes no responsibility or liability for any trading results or losses incurred as a result of using this indicator.
No TradingView affiliation: SwissAlgo is an independent entity and is not affiliated with or endorsed by TradingView.
LunarCrush data: The indicator utilizes publicly available data from LunarCrush. LunarCrush data and trademarks are the property of LunarCrush.
Consult a financial advisor: Consult with a qualified financial advisor before making any investment decisions.
By using this indicator, you acknowledge and agree to these terms. If you do not agree with these terms, please refrain from using this indicator.
ابحث في النصوص البرمجية عن "stop loss"

Strategy Development Environment [BerlinCode42]Happy Trade,
Intro
What is New
Algebraic/Boolean Equation
Instruction Set for The Algebraic/Boolean Equation
Example
Usage
Settings Menu
Declaration for Tradingview House Rules on Script Publishing
Disclaimer
Conclusion
1. Intro
This is a rich equipped fork of my previous "Backtest any Indicator v5". And serves as the fitting backtester and trade strategy creation tool for my upcoming ANN Indicators (artificial neural network).
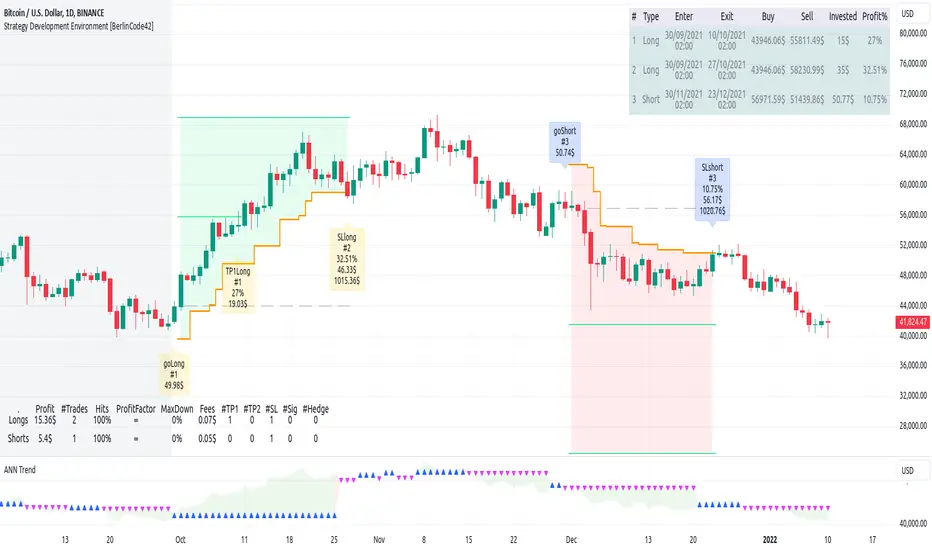
As the previous version this script has no trade signal generating code. The trade signals comes in by the five user settable input slots where the user plug-in external indicators. The final trade siganls go long etc are defined by a algebraic/boolean equation typed in as text in 4 terminals as shown in Image 0 . With this algebraic/boolean equations input the user can setup any trade logic as complex and fast and easy as never seen before here on TradingView.
Image 0
2. What is new
Input algebraic/boolean equations in text-form for go long, go short, exit long & exit short
Five input slots for external indicator signals
Equation tester
User settable signal delay for enter and exit trades
User selectable alternating trades filter
User settable exit long = enter short
Intrabar or trade only on bar closing
Time filter with duration input
User settable UTC Adjustment
Long and short trades possible
Two Take Profits with quantity setting
Trailing Stop
Webhook connection
3. Algebraic/Boolean Equation
This is where the magic happens. Unlike other backtesters that rely on drop-down menus to define trade signal equations—thus limiting the number of input signals and the complexity of logic—this script uses a string interpreter to solve equations. With this, you can develop your trade logic equations and add signals or conditions simply by writing them down in algebraic/boolean form.
The instruction set for this interpreter includes not only external input signals but also several internal values. These include BarTime, BarIndex, Open, High, Low, Close, True Range, Minimal Tick, Volume, and a signal that indicates whether there is an open trade (long, short, or none). You can also reference the values of past bars for all these inputs and, of course, use constant values in your equations. There is a sad limitation: Only one past bar value per equation is practicable. If you use more, errors can occur. It seems to be caused by the pipe line architecture of the parallel computing. In any attempt to solve this issue an older function call result was hand over.
The implemented functions cover a wide range of algebraic and boolean operations. A boolean "true" is represented by all values greater than zero, while "false" is represented by zero or values less than zero.
4. Instruction set for the Algebraic/Boolean Equation
There are functions that accept either two input values or one input value. The general form is (XandY) or (notX), where X and Y can be any input slot, predefined value, constant, or another sub-equation. Functions are always written in lowercase, while input slots and predefined values use uppercase letters.
Each sub-equation must be enclosed in parentheses, e.g., (A+B). Without proper use of parentheses, the interpreter cannot determine which function to calculate first. Negative constants must be expressed by subtracting from zero (e.g., (0-3.14)), so careful attention is required.
Here are some examples that demonstrate both incorrect and correct notations:
incorrect correct
(A+B*C) (A+(B*C))
(A+B+D+E) (A+(B+(D+E)))
(-20>A) ((0-20)>A)
(A*-B) (A*(0-B))
(AnotB) (Aand(notB))
ABS(a-b) (abs(A-B))
The correct usage ensures the interpreter calculates in the intended order.
And here comes the complete Instruction Set:
Addition: (A+B)
Subtraction: (A-B)
Multiplication: (A*B)
Division: (A/B)
Absolut value: (absA)
Power of: (A^B)
Natural Logarithm: (logA)
Lowest value of Low of last x bars: (lotx)
Highest value of High of last x bars: (hotx)
Modulo, Remainder of a Division: (A%B)
Round: (rndA)
round to ceil: (ceiA)
Round to floor: (floA)
Round to next minimal tick: (mitA)
EMA of A of last 3 bars: (e03A)
EMA of A of last 7 bars: (e07A)
EMA of A of last 10 bars: (e10A)
EMA of A of last 20 bars: (e20A)
EMA of A of last 50 bars: (e50A)
Smaller then: (AB)
Equal to: (A==B)
Unequal to: (A!=B)
And: (AandB)
Or: (AorB)
Exclusive Or: (AxorB)
Not: (notA)
Past bar value: (A ) ,whereby x can be 1,2,3,...,barIndex-1
Bar time: (T)
Bar index: (I)
Opening Price of Bar: (O)
Highest Price of Bar: (H)
Lowest Price of Bar: (L)
Closing Price of Bar: (C)
Min tick value for the current symbol: (K)
Trade Volume: (V)
True Range: (R)
Is Money invested: (M) ,Long position: M=1,
Short position: M=-1,
No position: M=0
Reminder: if you wanna replace A or B above don't forget the parentheses. So if you have (logA) and wanna replace A with D+F so the correct replacement would be (log(D+F)).
In the following there are some examples of popular bar patterns and useful filters:
Doji: ((abs(O-C))<(10*K))and((H-L)>(100*K))
green Hammer: (((H-C)<(5000*K))and(((O-L)/2)>(abs(O-C)))
Up trend: (C>(e10H))
Down trend: (C<(e10L))
cool down 7 bars: (( any buy condition )and((e07(absM))==0))
possible Pivot High: (H==(hot30))and((CC))
possible Pivot Low: (L==(lot30))and((C>H )or(O0)), goShort ((A>0)and((A )<0)), Enter Signal delay=0, Exit Signal delay=0, Alternate Trades=true
take profit 1 =0.4% (30%), take profit 2 =0.7%, trailing stop loss=0.2%, intrabar, start capital=1000$, qty=5%, fee=0.05%, no Session Filter
Image 1
6. Usage
First you need to attach some signals from external Indicators. In the example above we use the Stochastic RSI indicator from TradingView. Load the Stochastic RSI indicator to the chart. Then you go to the settings menu of this script, choose in the drop-down menu of Input A the signal .
In case you wanna use a signal which is not in the drop-down menu of Input A do the following:
1) You need to know the name of the boolean (or integer) variable of your indicator which hold the desired signal. Lets say that this boolean variable is called BUY. If this BUY variable is not plotted on the chart you simply add the following code line at the end of your pine script.
For boolean (true/false) BUY variables use this:
plot(BUY ? 1:0,'Your buy condition hold in that variable BUY',display = display.data_window)
And in case your script's BUY variable is an integer or float then use instate the following code line:
plot(BUY ,'Your buy condition hold in that variable BUY',display = display.data_window)
2) Probably the name of this BUY variable in your indicator is not BUY. Simply replace in the code line above the BUY with the name of your script's trade condition variable.
3) Do the same procedure for your SELL variable. Then save your changed Indicator script.
4) Then add the changed Indicator script from step before and this backtester script to the chart ...
5) and go to the settings of it. Choose under "Settings -> Input A " your Indicator. So in the example above choose .
The form is usually: ' : BUY'. Then you see something like Image 1
6) Decide about each trade logic for Go Long and Go Short . In this Example we use for GoLong if "Stoch RSI: K" is smaller then 20. The "Stoch RSI: K" we already loaded it in input A. So we set under Go Long (A<20) and set Enter Signal Delay to 0.
Now we setup Go Short if "Stoch RSI: K" is bigger then 80. So we set under Go Short A>80. Enter Signal Delay is already set.
7) For the Exit conditions you can choose (trailing) Stop loss or Take Profit or Exit by Indicator Signal. What ever comes first triggers the exit. If you like to use an EMA Indicator for the Exit by Indicator just load it in a free input slot B, D, E, F or use the inbuild EMA. For this example we use the inbuild EMA of the last 7 values of close. It is called by the following equation: (e07C). So to exit a long trade when the close price crossunder this EMA you have to type in Exit Long ((e07C)>C). For exit a short trade enter in Exit Short ((e07C)
Pattern Pro VPOCSummary:
This indicator combines multi-timeframe pattern detection (triangles and wedges), Volume Point of Control (VPOC) visualization, predictive volume modeling, and a swing-based VWAP. It provides traders with a detailed view of key trading patterns, high-volume levels, and entry/exit opportunities, all integrated into one powerful tool.
How This Script is Unique:
Multi-Timeframe Pattern Analysis:
Identifies chart patterns like triangles and wedges across multiple timeframes, enhancing the trader's ability to spot actionable opportunities.
Dynamically tracks pivot points and projected trendlines to visualize ongoing and potential patterns.
Volume Point of Control (VPOC):
Automatically calculates and plots the VPOC for detected patterns, highlighting the price level with the highest traded volume.
Helps identify strong support/resistance levels within patterns.
Predictive Volume Modeling:
Predicts high-volume trading times based on historical averages, allowing traders to anticipate periods of increased market activity.
Bars are color-coded to reflect projected volume activity.
Swing-Based VWAP:
Incorporates swing highs and lows into VWAP calculations, making it adaptive to current market conditions.
Offers a more dynamic view compared to traditional static VWAP indicators.
Trade Management Features:
Visualizes stop-loss (SL) and take-profit (TP) levels directly on the chart.
Tracks active trades and peak performance, enabling effective trade management.
Customizability:
Offers user-defined settings for timeframe selection, risk management, and volume modeling, making it adaptable to various trading strategies.
How to Use:
Pattern Detection:
The script automatically identifies triangle and wedge patterns. No manual input is needed for detection.
Patterns are displayed with top and bottom trendlines and the associated VPOC.
Volume Modeling:
Enable "Use Predictive Volume" under the Predictive Volume settings to highlight periods of projected high activity.
Customize the moving average period and date range for better precision.
Swing-Based VWAP:
Enable "Use VWAP" and configure the anchor period to suit your trading timeframe (e.g., Session, Week, Month).
The VWAP adapts dynamically to swings for precise insights.
Risk Management:
Adjust initial risk, multiplier, and drawdown limits under Risk Management settings.
Visual SL and TP boxes make it easy to monitor trade progress.
Alerts:
Enable "Pattern Alert" to receive notifications for detected patterns.
Use "Trade Alert" to get notified of potential entry opportunities.
Custom Inputs:
Customize "Lookback Bars for VPOC" to define how far back the indicator searches for volume data.
Modify "Row Size" and "POC Settings" for precise VPOC plotting.
Related Links:
Swing-Based VWAP
Intraday Predictive High-Volume Activity Sessions
Trade Settings:
Pattern Timeframe Input:
Select the timeframe used for detecting patterns (e.g., Chart, 15m, 1H).
Use: Helps identify patterns specific to the selected timeframe.
Bars to Entry:
Defines the number of bars within which a trade should be entered after a pattern is detected.
Use: Ensures timely entries based on identified patterns.
Plot Peak Profit:
Toggles the visualization of the peak profit level for trades.
Use: Helps monitor the maximum potential profit from a trade.
Use Close of Candle Above/Below Top/Bottom Line:
When enabled, the script uses the close of the candle instead of wicks to determine line breakouts.
Use: Ensures more precise break detection for pattern confirmation.
Pattern VPOC Settings:
Lookback Bars for VPOC:
Specifies the number of bars to analyze for calculating the Volume Point of Control (VPOC).
Use: Adjusts the depth of data analyzed for VPOC determination.
Row Size:
Determines the granularity of VPOC calculations. Higher values result in finer divisions.
Use: Fine-tune VPOC plotting for greater precision.
Pattern VPOC Color:
Sets the color of the VPOC line on the chart.
Use: Customize chart aesthetics for better visibility.
Width:
Adjusts the thickness of the VPOC line.
Use: Makes the line more prominent on the chart.
Risk Management:
Initial Risk:
Specifies the base risk amount for each trade.
Use: Helps determine the trade size based on risk tolerance.
Risk Increment Type:
Selects whether risk increments are linear or exponential after consecutive losses.
Use: Adjusts risk dynamically to manage losses effectively.
Multiplier:
Multiplies the risk in exponential mode to calculate the next risk value after a loss.
Use: Defines the growth factor for exponential risk.
Max Drawdown:
Sets the maximum drawdown value before halting trading.
Use: Protects against significant capital depletion.
Initial Capital:
Specifies the starting capital for performance calculations.
Use: Helps measure performance and calculate drawdown percentages.
Alert Settings:
Trade Alert:
Enables alerts for detected trade setups.
Use: Keeps the user notified about potential trade opportunities.
Pattern Alert:
Enables alerts for detected patterns.
Use: Provides immediate notification when a pattern is identified.
Predictive Volume:
Use Predictive Volume:
Toggles the predictive volume modeling feature.
Use: Highlights projected high-volume periods for better timing.
Select Timeframe for Predictive Volume:
Defines the timeframe for predictive volume analysis.
Use: Allows predictive modeling to align with the user's trading style.
MA Average Periods:
Sets the moving average length for volume prediction.
Use: Smoother or more responsive predictive models based on user preference.
Date Range:
Specifies the historical range used for volume analysis.
Use: Limits the scope of volume data for calculations.
VWAP Settings:
Use VWAP:
Toggles the VWAP calculation and plotting.
Use: Tracks the average price weighted by volume to find key price levels.
Hide VWAP on 1D or Above:
Hides VWAP plots on daily or higher timeframes.
Use: Avoids clutter on charts with higher timeframes.
Anchor Period:
Sets the anchor period for VWAP calculation (e.g., Session, Week, Month).
Use: Aligns VWAP with the selected timeframe.
Source:
Defines the price source for VWAP calculation (default: hlc3).
Use: Adjusts VWAP based on the preferred price type.
Offset:
Adjusts the VWAP line's placement by the specified number of bars.
Use: Moves the VWAP line forward or backward for better visual alignment.
Swing Size:
Defines the sensitivity for detecting swing highs and lows in VWAP calculations.
Use: Refines VWAP calculations to match market swings.

TradingIQ - Counter Strike IQIntroducing "Counter Strike IQ" by TradingIQ
Counter Strike IQ is an exclusive trading algorithm developed by TradingIQ, designed to trade upside/downside breakouts of varying significance. By integrating artificial intelligence and IQ Technology, Counter Strike IQ analyzes historical and real-time price data to construct a dynamic trading system adaptable to various asset and timeframe combinations.
Philosophy of Counter Strike IQ
Counter Strike IQ operates on a single premise: Support and resistance levels cannot hold forever. At some point either side must break for the underlying asset to exhibit trends; otherwise, prices would be confined to an infinitely narrowing range.
Counter Strike IQ is designed to work straight out of the box. In fact, its simplicity requires just four user settings to manage output, making it incredibly straightforward to manage.
Minimum ATR Profit, Minimum ATR Stop, EMA Filter and EMA Filter Length are the only settings that manage the performance of Counter Strike IQ!
Traders don’t have to spend hours adjusting settings and trying to find what works best - Counter Strike IQ handles this on its own.
Key Features of Counter Strike IQ
Self-Learning Breakout Detection
Employs AI and IQ Technology to identify notable breakouts in real-time.
AI-Generated Trading Signals
Provides breakout trading signals derived from self-learning algorithms.
Comprehensive Trading System
Offers clear entry and exit labels.
Performance Tracking
Records and presents trading performance data, easily accessible for user analysis.
Self-Learning Trading Exits
Counter Strike IQ learns where to exit positions.
Long and Short Trading Capabilities
Supports both long and short positions to trade various market conditions.
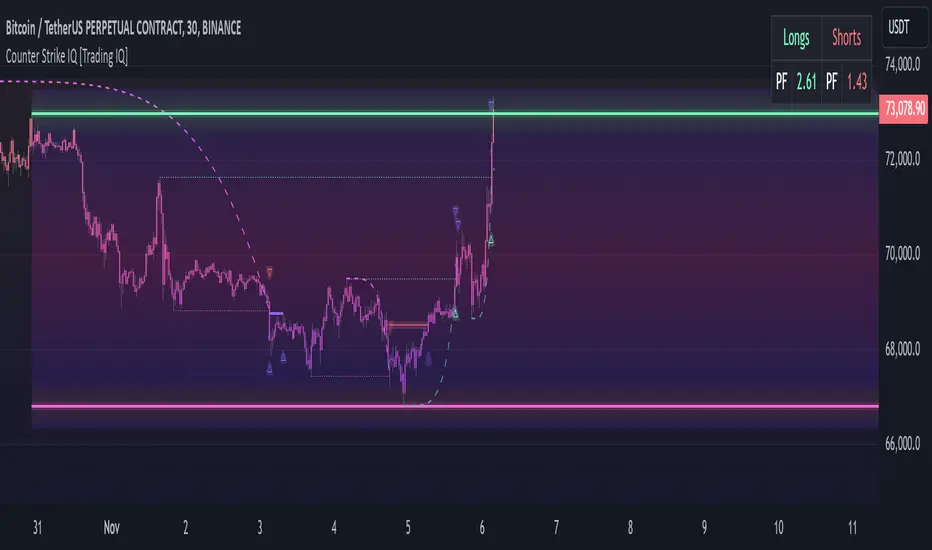
Strike Channel
The Strike Channel represents what Counter Strike IQ considers a tradable long opportunity or a tradable short opportunity. The Strike Channel is dynamic and adjusts from chart to chart.
IQ Graph Gradient
Introduces the IQ Graph Gradient, designed to classify extreme values in price on a grand scale.
How It Works
Counter Strike IQ operates on a straightforward heuristic: go long during significant upside price moves that break established resistance levels and go short during significant downside price moves that break established support levels.
IQ Technology, TradingIQ's proprietary AI algorithm, defines what constitutes a “significant price move” and what’s considered a tradable breakout. For Counter Strike IQ, this algorithm evaluates all historical support/resistance breaks and any subsequent breakouts. For instance, the price move following up to a breakout is measured and learned from, including the significance of the identified support/resistance level (how long it’s been active, how far price moved away from it, etc). By analyzing these patterns, Counter Strike IQ adapts to identify and trade similar future breakout sequences.
In simple terms, Counter Strike IQ learns from violations of historical support/resistance levels to identify potential entry points at currently established support/resistance levels. Using this knowledge, it determines the optimal, current support/resistance price level where a breakout has a higher chance of occurring.
For long positions, Counter Strike IQ places a stop-market order at the AI-identified resistance point. If price violates this level a market order will be placed and a long position entered. Of course, this is how the algorithm trades, users can elect to use a stop-limit order amongst other order types for position entry. After the position is entered TP1 is placed (identifiable on the price chart). TP1 has a twofold purpose:
Acts as a legitimate profit target to exit 50% of the position.
Once TP1 is closed over, the initial stop loss is converted to a trailing stop, and the long position remains active so long as price continues to uptrend.
For short positions, Counter Strike IQ places a stop-market order at the AI-identified support point. If price violates this level a market order will be placed and a short position entered. Again, this is how the algorithm trades, users can elect to use a stop-limit order amongst other order types for position entry. Upon entry TP1 is placed (identifiable on the price chart). TP1 has a twofold purpose:
Acts as a legitimate profit target to exit 50% of the position.
Once TP1 is closed over, the initial stop loss is converted to a trailing stop, and the short position remains active so long as price continues to downtrend.
As a trading system, Counter Strike IQ exits TP1 using a limit order, with all stop losses exited as stop market orders.
What Classifies As a Tradable Upside Breakout or Tradable Downside Breakout?
For Counter Strike IQ, tradable price breakouts are not manually set but are instead learned by the system. What qualifies as a significant upside or downside breakout in one market might not hold the same significance in another. Counter Strike IQ continuously analyzes historical and current support/resistance levels, how far price has extended from those levels, the raw-dollar price move leading up to a violation of those levels, their longevity, and more, to determine which future levels have a higher chance of breaking out when retested!
The image above illustrates the Strike Channel and explains the corresponding prices and levels
The green upper line represents the Long Breakout Point.
The pink lower line represents the Short Breakout Point.
Any price between the two deviation points is considered “Acceptable”.
The image above shows a long position being entered after the Upside Breakout Point was reached.
Green arrows indicate that the strategy entered a long position at the highlighted price level.
Blue arrows indicate that the strategy exited a position, whether at TP1, the initial stop loss, or at the trailing stop.
Blue lines indicate the TP1 level for the current trade. Red lines indicate the initial stop loss price.
If price closes above TP1, the initial stop loss will be replaced with a trailing stop. A blue line (similar to the blue line shown for TP1) will trail price and correspond to the trailing stop price of the trade.
The image above shows the trailing stop price, represented by a blue line, used for the long position!
You can also hover over the trade labels to get more information about the trade—such as the entry price and exit price.
The image above shows a short position being entered after the Downside Breakout Point was reached.
Red arrows indicate that the strategy entered a short position at the highlighted price level.
Blue arrows indicate that the strategy exited a position, whether at TP1, the initial stop loss, or at the trailing stop.
Blue lines indicate the TP1 level for the current trade. Red lines indicate the initial stop loss price.
If price closes below TP1, the initial stop loss will be replaced with a trailing stop. A blue line (similar to the blue line shown for TP1) will trail price and correspond to the trailing stop price of the trade.
The image above shows the trailing stop price, represented by a blue line, used for the short position!
You can also hover over the trade labels to get more information about the trade—such as the entry price and exit price.
IQ Gradient Graph
The IQ Gradient Graph provides a macro characterization of extreme prices.
The lower macro extremity of the IQ Gradient Graph is colored green, while the upper macro extremity is colored red.
Minimum Profit Target And Stop Loss
The Minimum ATR Profit Target and Minimum ATR Stop Loss setting control the minimum allowed profit target and stop loss distance. On most timeframes users won’t have to alter these settings; however, on very-low timeframes such as the 1-minute chart, users can increase these values so gross profits exceed commission.
After changing either setting, Counter Strike IQ will retrain on historical data - accounting for the newly defined minimum profit target or stop loss.
AI Direction
The AI Direction setting controls the trade direction Counter Strike IQ is allowed to take.
“Trade Longs” allows for long trades.
“Trade Shorts” allows for short trades.
EMA Filter
The EMA Filter setting controls whether the AI should implement an EMA trading filter. Simply, if the EMA Filter is active, long trades can only initiate if price is trading above the user-defined EMA. Conversely, short trades can only initiate if price is trading below the user-defined EMA.
The image above shows the EMA Filter in action!
Verifying Counter Strike IQ’s Effectiveness
Counter Strike IQ automatically tracks its performance and displays the profit factor for the long strategy and the short strategy it uses. This information can be found in the table located in the top-right corner of your chart showing.
This table shows the long strategy profit factor and the short strategy profit factor.
The image above shows the long strategy profit factor and the short strategy profit factor for Counter Strike IQ.
A profit factor greater than 1 indicates a strategy profitably traded historical price data.
A profit factor less than 1 indicates a strategy unprofitably traded historical price data.
A profit factor equal to 1 indicates a strategy did not lose or gain money when trading historical price data.
Using Counter Strike IQ
While Counter Strike IQ is a full-fledged trading system with entries and exits - manual traders can certainly make use of its on chart indications and visualizations.
The hallmark feature of Counter Strike IQ is its ability to signal a breakout near its origin point. Long entries are often signaled near the start of a large upside price move; short entries are often signaled near the start of a large downside price move.
For live analysis, the Strike Channel serves as a valuable tool for identifying breakout points.
The further price moves toward the Upside Breakout Point (green), the stronger the indication that price might breakout to the upside. Conversely, the deeper price reaches toward the Downside Breakout Point (red), the stronger the indication that price might breakout to the downside.
Of course, should buying or selling pressure stall, price may fail to breakout at the identified breakout level. This is a natural consequence of any breakout trading strategy!
With this information at hand, traders can quickly switch between charts and timeframes to identify optimized areas of interest.
Paid script
Multi-Pairs Stratrgy Backtesting ScreenerThis indicator is for viewing and checking the results of a specific strategy simultaneously on 25 currency pairs. Results such as number of trades, wins, losses, canceled trades and most importantly win rate.
Long condition is as follows:
Short condition is as follows:
An Alert Fibo Level is built in to indicate the buy or sell status.
Reset Deal Calculation Fibo Level , if the price hits it, the indicator resets all calculations and prepares for the next situation.
If Other situation appear after missed situation, indicator consider it:
All statistics collected in Screener Table :
Date Period:
Users can customize the date period during which the strategy is tested, allowing for a more granular analysis of performance over specific timeframes.
Entry:
Entry is based on Fibonacci level between the Lower Low and Higher High pivots for Long deals.
Entry is based on Fibonacci level between the Higher High and Lower Low pivots for Short deals.
Allowing a second entry
There is a feature that If the risk-to-reward ratio is below the specified input (rr), the trading deal wont initiate.
Stop Loss:
Adjustable based on Fibonacci levels , Base Pivot, Percent and ATR.
The Base Pivot is calculate from LL pivot point for Long and HH pivot point for short (not Entry price).
The Percent and ATR is calculate from Entry price.
Targets:
Adjustable based on Source, Fibonacci levels , Percent and ATR.
Source indicates the maximum (minimum) value between the open and close of the candle where the Higher High (Lower Low) pivot point was formed for Long (Short) deals.
Percent and ATR calculates from Entry 1 Price
Exit Methods :
The goal is to offer users a diverse set of exits before the price touches the target or stop loss.
1. Pending Entry Time-out
cancel pending entry based on candle counting since alert fired. (before deal started)
2. Active Deal Reverse
If a deal (long or short position) is currently open, and the reverse signal is emitted, the script will close the existing deal.
3. Reverse Deal Exit
If a deal (long or short position) is currently open, and the reverse signal is emitted, the script will automatically close the existing deal.
4. Move Exit
With this method, if Entry 2 is triggered, the deal will be closed when the price touches the Entry price.
5. Candle Counting Exit
This exit type is based on the number of candles since the deal started.

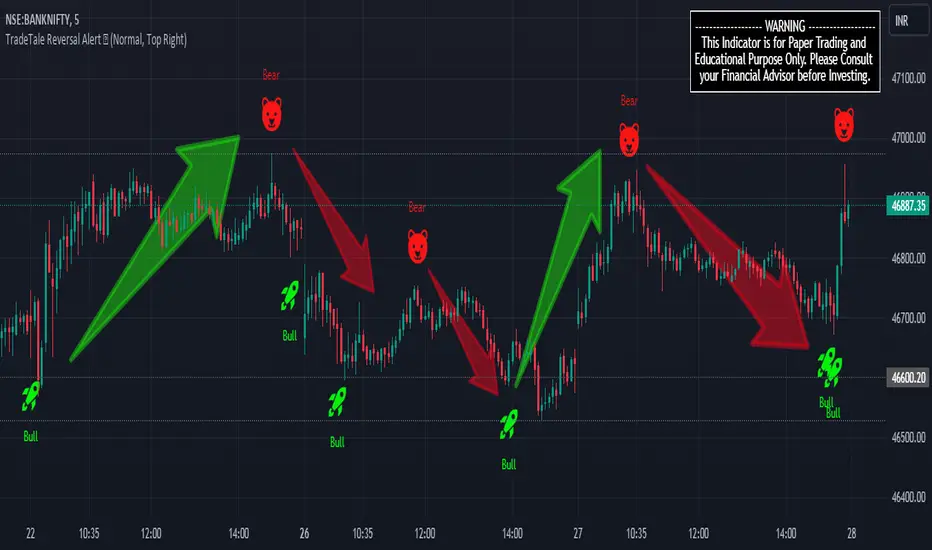
TradeTale Reversal Alert 🚀This script explains how RSI Oscillator along with Bollinger Bands & Moving Average can be used to catch "Reversal Points".
What is an Oscillator:-
An oscillator is a technical analysis tool that constructs high and low bands between two extreme values and then builds a trend indicator that fluctuates within these bounds. Traders use the trend indicator to discover short-term overbought or oversold conditions. RSI with MA is used along with minor calculations (maths) in this Oscillator for generating Long and Short signals.
RSI:-
RSI is a momentum oscillator which measures the speed and change of price movements. RSI moves up and down (oscillates) between ZERO and 100. Generally RSI above 70 is considered overbought and below 30 is considered oversold. Some traders may use a setting of 20 and 80 for oversold and overbought conditions respectively. Some traders may use a setting of 10 and 90 for oversold and overbought conditions respectively. However this may reduce the number of signals. 10 to 30 is shown as bullish zone and 70 to 90 is shown as bearish zone in this Oscillator.
Calculation:-
There are three basic components in the RSI - Avg Gain, Avg Loss & RS.
Avg Gain = Average of Upward Price Change
Avg Loss = Average of Downward Price Change
RS = (Avg Gain)/(Avg Loss)
RSI = 100 – (100 / (1 +RS ))
First Calculation:-
RSI calculation is based on default 14 periods.
Average gain and Average loss are simple 14 period averages.
Average Loss equals the sum of the losses divided by 14 for the first calculation.
Average Gain equals the sum of the Gains divided by 14 for the first calculation.
First Average Gain = Sum of Gains over the past 14 periods / 14.
First Average Loss = Sum of Losses over the past 14 periods / 14.
The formula uses a positive value for the average loss.
RS values are smoothed after the first calculation.
Second Calculation:-
Subsequent calculations multiply the prior value by 13, add the most recent value, and divide the total by 14.
Average Gain = / 14.
Average Loss = / 14.
if
Average Loss = 0, RSI = 100 (means there were no losses to measure).
Average Gain = 0, RSI = 0 (means there were no gains to measure).
Moving Average (MA):-
A moving average (MA) is used in technical analysis, used to help smooth out price data by creating a constantly updated average price. A rising moving average indicates that the security is in an uptrend, while a declining moving average indicates a downtrend.
Bollinger Bands (BB):–
It is consists of a Moving Average line and two standard deviation lines that are plotted above and below the moving average line. The moving average periods & standard deviation can be adjust according to the preference. Bollinger Bands help traders to identify the volatility and potential price range of security.
Logic of this indicator:-
RSI is an oscillator that fluctuates between zero and 100 which makes it easy to use for many traders. Its easy to identify extremes because RSI is range-bound.
Bollinger Band Upper and Lower Bands are used to identify Overbought & Oversold points Respectively. Price crossover of these Upper & Lower Bands used to calculate Reversal Points.
BB, RSI and MA calculations along with maths is used to generate signals.
Rocket signal in is Long Signal and also exit Short signal. (Bullish Entry/Exit)
Bear signal is Short Signal and also exit Long signal. (Bearish Entry/Exit)
But remember that RSI works best in range bound market and is less trustworthy in trending markets. (caution)
A new trader need to be cautious because during strong trends in the market/security, RSI may remain in overbought (70 to 90) or oversold (10 to 30) for extended periods.
Also Bollinger Bands here are used to calculate range reversal, So is less trustworthy in trending markets. (caution)
Chart Timeframe:-
This Indicator works on all timeframes.
Traders should set stop loss and take profit levels as per risk reward ratio.
Note:
Don't confuse RSI and relative strength. RSI is changes in the price momentum of a security.
whereas relative strength compares the price performance of two or more securities.
Like other technical indicators, This indicator also is not a holy grail. It can only assist you in building a good strategy. You can only succeed with proper position sizing, risk management and following correct trading Psychology (No overtrade, No greed, No revenge trade etc).
THIS INDICATOR IS FOR EDUCATIONAL PURPOSE AND PAPER TRADING ONLY. YOU MAY PAPER TRADE TO GAIN CONFIDENCE AND BUILD FURTHER ON THESE. PLEASE CONSULT YOUR FINANCIAL ADVISOR BEFORE INVESTING. WE ARE NOT SEBI REGISTERED.
Hope you all like it
happy learning.
TradeTale OscillatorThis script explains how Oscillator can be used to catch market moves within a Range.
What is an Oscillator:-
An oscillator is a technical analysis tool that constructs high and low bands between two extreme values and then builds a trend indicator that fluctuates within these bounds. Traders use the trend indicator to discover short-term overbought or oversold conditions. RSI with MA is used along with minor calculations (maths) in this Oscillator for generating Long and Short signals.
RSI:-
RSI is a momentum oscillator which measures the speed and change of price movements. RSI moves up and down (oscillates) between ZERO and 100. Generally RSI above 70 is considered overbought and below 30 is considered oversold. Some traders may use a setting of 20 and 80 for oversold and overbought conditions respectively. Some traders may use a setting of 10 and 90 for oversold and overbought conditions respectively. However this may reduce the number of signals. 10 to 30 is shown as bullish zone and 70 to 90 is shown as bearish zone in this Oscillator.
Calculation:-
There are three basic components in the RSI - Avg Gain, Avg Loss & RS.
Avg Gain = Average of Upward Price Change
Avg Loss = Average of Downward Price Change
RS = (Avg Gain)/(Avg Loss)
RSI = 100 – (100 / (1 +RS ))
First Calculation:-
RSI calculation is based on default 14 periods.
Average gain and Average loss are simple 14 period averages.
Average Loss equals the sum of the losses divided by 14 for the first calculation.
Average Gain equals the sum of the Gains divided by 14 for the first calculation.
First Average Gain = Sum of Gains over the past 14 periods / 14.
First Average Loss = Sum of Losses over the past 14 periods / 14.
The formula uses a positive value for the average loss.
RS values are smoothed after the first calculation.
Second Calculation:-
Subsequent calculations multiply the prior value by 13, add the most recent value, and divide the total by 14.
Average Gain = / 14.
Average Loss = / 14.
if
Average Loss = 0, RSI = 100 (means there were no losses to measure).
Average Gain = 0, RSI = 0 (means there were no gains to measure).
Moving Average (MA):-
A moving average (MA) is used in technical analysis, used to help smooth out price data by creating a constantly updated average price. A rising moving average indicates that the security is in an uptrend, while a declining moving average indicates a downtrend.
Logic of this indicator:-
RSI is an oscillator that fluctuates between zero and 100 which makes it easy to use for many traders.
Its easy to identify extremes because RSI is range-bound.
RSI and MA calculations along with maths is used to generate signals.
Rocket signal in white colour is Long Signal and also exit Short signal. (Bullish Entry/Exit)
Scissor signal in orange colour is Short Signal and also exit long signal. (Bearish Entry/Exit)
Green colour band shows bullish momentum & Red colour band shows bearish momentum.
But remember that RSI works best in range bound market and is less trustworthy in trending markets. (caution)
A new trader need to be cautious because during strong trends in the market/security, RSI may remain in overbought (70 to 90) or oversold (10 to 30) for extended periods.
Chart Timeframe:-
This Oscillator works on all timeframes.
Traders should set stop loss and take profit levels as per risk reward ratio.
Note:
Don't confuse RSI and relative strength. RSI is changes in the price momentum of a security.
whereas relative strength compares the price performance of two or more securities.
Like other technical indicators, This Oscillator also is not a holy grail. It can only assist you in building a good strategy. You can only succeed with proper position sizing, risk management and following correct trading Psychology (No overtrade, No greed, No revenge trade etc).
THIS OSCILLATOR IS FOR EDUCATIONAL PURPOSE AND PAPER TRADING ONLY. YOU MAY PAPER TRADE TO GAIN CONFIDENCE AND BUILD FURTHER ON THESE. PLEASE CONSULT YOUR FINANCIAL ADVISOR BEFORE INVESTING. WE ARE NOT SEBI REGISTERED.
Hope you all like it
happy learning.

RSI 11 IndicatorThis script explains how RSI can be used to catch market moves in trend, reversal or sideways market.
What is RSI indicator:-
RSI is a momentum oscillator which measures the speed and change of price movements. RSI moves up and down (oscillates) between ZERO and 100. Generally RSI above 70 is considered overbought and below 30 is considered oversold. Some traders may use a setting of 20 and 80 for oversold and overbought conditions respectively. However this may reduce the number of signals. You can also use RSI to identify divergences, strength, reversals, general trend etc.
Calculation:-
There are three basic components in the RSI - Avg Gain, Avg Loss & RS.
Avg Gain = Average of Upward Price Change
Avg Loss = Average of Downward Price Change
RS = (Avg Gain)/(Avg Loss)
RSI = 100 – (100 / (1 +RS ))
First Calculation:-
RSI calculation is based on default 14 periods.
Average gain and Average loss are simple 14 period averages.
Average Loss equals the sum of the losses divided by 14 for the first calculation.
Average Gain equals the sum of the Gains divided by 14 for the first calculation.
First Average Gain = Sum of Gains over the past 14 periods / 14.
First Average Loss = Sum of Losses over the past 14 periods / 14.
The formula uses a positive value for the average loss.
RS values are smoothed after the first calculation.
Second Calculation:-
Subsequent calculations multiply the prior value by 13, add the most recent value, and divide the total by 14.
Average Gain = / 14.
Average Loss = / 14.
if
Average Loss = 0, RSI = 100 (means there were no losses to measure).
Average Gain = 0, RSI = 0 (means there were no gains to measure).
Logic of this indicator:-
RSI is an oscillator that fluctuates between zero and 100 which makes it easy to use for many traders.
Its easy to identify extremes because RSI is range-bound.
But remember that RSI works best in range bound market and is less trustworthy in trending markets.
A new trader need to be cautious because during strong trends in the market/security, RSI may remain in overbought or oversold for extended periods.
Chart Timeframe:-
RSI indicator works well on all timeframes.
Timeframe depends on which strategy or settings are you using.
Generally a lower timeframe like 1 min, 3 min, 5 min, 15 min, 30 min, 1 Hr etc is used for intraday trades or short duration trades
and higher timeframes like 1 day, 1 week, 1 month are used for positional or long term trades.
Please Read the Idea "Mastering RSI with 11 Strategies" to understand this indicator better.
Indicator 1
Basis Strategy of Overbought and Oversold
Usually an asset with RSI reading of 70 or above indicates a bullish and an overbought situation.
overbought can be seen as trading at a higher price than it should.
traders may expect a price correction or trend reversal and sell the security.
but RSI indicator can stay in the overbought for a long time when the stock is in uptrend - This may trap an immature trader.
an Immature trader will enter a sell position when RSI become overbought (70), whereas a mature trader will enter sell position when RSI line crosses below the overbought line (70).
An asset with RSI reading of 30 or below indicates a bearish and an oversold condition.
oversold can be seen as trading at a lower price than it should.
traders may expect a price correction or trend reversal and buy the security.
but RSI indicator can stay in the oversold for a long time when the stock is in downtrend - This may trap an immature trader.
an Immature trader will enter a buy position when RSI become oversold (30), whereas a mature trader will enter buy position when RSI line crosses above the oversold line (30).
Center dotted Mid line is RSI 50.
Chart RSI is shown in yellow colour.
Red shaded area above the red horizontal line shows the stock or security has entered overbought condition. "R" signal in red shows a likely downside reversal, means it may be a likely Selling opportunity.
Green shaded area below the green horizontal line shows the stock or security has entered oversold condition. "R" signal in green shows a likely upside reversal, means it may be a likely Buying opportunity.
Note:-
so its better to wait for reversal signal.
traders may use 20 instead of 30 as oversold level and 80 instead of 70 as overbought level.
new traders may learn to use the indicator as per the prevailing trend to get better results.
false signals may be avoided by using bullish signals in bullish trend and bearish signals in bearish trend.
Indicator 2
RSI Strength Crossing 50
RSI crossing centreline 50 in the below chart showing strength and buy/sell signal.
Centre line is at RSI 50.
if RSI is above 50 its considered bullish trend. (increasing strength)
if RSI is below 50 its considered bearish trend. (decreasing strength)
RSI crossing centre line (50) upside may be a buy signal.
RSI crossing centre line (50) downside may be a sell signal.
"B" signal in green colour shows that RSI is crossing above Mid 50 horizontal line, which may be a likely Buy signal.
"S" signal in red colour shows that RSI is crossing below Mid 50 horizontal line, which may be a likely Sell signal.
Indicator 3
RSI 40 and RSI 60 Support and Resistance
RSI 40 acting as support in the below chart
In an uptrend RSI tends to remain in the 40 to 90 range with 40 as support (buying opportunity at support).
RSI 60 acting as resistance in the below chart
In a downtrend RSI tends to remain in 10 to 60 range with 60 as resistance (selling opportunity at resistance).
"40" signal in green colour shows that RSI is crossing above 40 horizontal line, which may be a likely Support in making and a Buy signal.
"60" signal in red colour shows that RSI is crossing below 60 horizontal line, which may be a likely Resistance in making and a Sell signal.
Note:-
These ranges may change depending on RSI settings and change in the market trend.
Indicator 4
RSI Divergence
Below chart shows a simple example of Bullish Divergence and Bearish Divergence.
An RSI divergence occurs when price moves in the opposite direction of the RSI.
A bullish divergence is when price is falling but RSI is rising. which means RSI making higher lows and price making lower lows (buy signal).
A bearish divergence is when price is rising but RSI is falling. which means RSI making lower high and price making higher highs (sell signal).
Divergences are more strong when appear in an overbought or oversold condition.
There may be many false signals during a strong uptrend or strong downtrend.
In a strong uptrend, RSI may show many false bearish divergences before finally reversing down.
same way in a strong downtrend, RSI may show many false bullish divergences before finally reversing up.
"Bull Div" signal along with divergence line in green colour shows Bullish Divergence, which may be a likely Buy signal.
"Bear Div" signal along with divergence line in red colour shows Bearish Divergence, which may be a likely Sell signal.
Indicator 5
Double Top & Double Bottom
Double Bottom = RSI goes below oversold (30). RSI comes back above 30. RSI falls back again towards 30 and again rise making a Double bottom. its a signal of buying and likely upside reversal.
Double Top = RSI goes above overbought (70). RSI comes back below 70. RSI rises back again towards 70 and again fall making a Double top. its a signal of selling and likely downside reversal.
Double Bottom is shown with Green Dashed line joining two low's of RSI indicating a likely Buy Signal.
Double Top is shown with Red Dashed line joining two High's of RSI indicating a likely Sell Signal.
Indicator 6
Trendline Support and Resistance
Below chart shows RSI Trendline Resistance and Support
RSI resistance trendline = Connect three or more points on the RSI line as it falls to draw a RSI downtrend line (RSI resistance trendline).
Everytime it takes resistance from a RSI downtrend line its a selling opportunity.
RSI support trendline = Connect three or more points on the RSI line as it rises to draw a RSI uptrend line (RSI support trendline).
Everytime it takes support on a RSI uptrend line its a buying opportunity.
RSI Resistance trendline shown in Red colour indicating a likely fall again after rejection from this Red trendline till the time RSI breaks above it to change the trend from Bearsih to Bullish.
RSI support trendline shown in Green colour indicating a likely Rise again after support from this Green trendline till the time RSI breaks below it to change the trend from Bullish to Bearish.
Indicator 7
Trendline Breakout and Breakdown
Below chart shows RSI Trendline Breakout and Breakdown
RSI resistance trendline Breakout = Connect three or more points on the RSI line as it falls to draw a RSI downtrend line (RSI resistance trendline).
Whenever it breakout above RSI resistance trendline its a buying opportunity.
RSI support trendline Breakdown = Connect three or more points on the RSI line as it rises to draw a RSI uptrend line (RSI support trendline).
Whenever it breakdown below RSI support trendline its a selling opportunity.
Note:-
Correlate both the RSI and the closing price to ensure proper breakout or breakdown.
Challenge is to correctly identify if a breakout or breakdown is sustainable or its a false signal.
Indicator 8
RSI Crossover same timeframe
RSI with two different RSI length crossing each other on same timeframe.
when lower RSI length crossing above higher RSI length its a buy signal.
when lower RSI length crossing below higher RSI length its a sell signal.
for example RSI with length 7 & length 14 on 15 Minutes timeframe.
Green Cross shows that Fast RSI is crossing above Slow RSI on the same timeframe with different RSI length Settings, which means it may be a likely Buy Signal.
Red Cross shows that Fast RSI is crossing below Slow RSI on the same timeframe with different RSI length Settings, which means it may be a likely Sell Signal.
Indicator 9
RSI Crossover Multi timeframe
RSI with same RSI length but on two different timeframes crossing each.
when lower timeframe RSI crossing above higher timeframe RSI its a buy signal.
when lower timeframe RSI crossing below higher timeframe RSI its a sell signal.
for example RSI with length 14 on 5 Minutes and 1 Hr timeframes.
Green Cross shows that Lower Timeframe RSI is crossing above Higher Timeframe RSI with same RSI length Settings, which means it may be a likely Buy Signal.
Red Cross shows that Lower Timeframe RSI is crossing below Higher Timeframe RSI with same RSI length Settings, which means it may be a likely Sell Signal.
Indicator 10
RSI EMA/WMA/SMA Crossover
when RSI crossing above EMA/WMA/SMA its a buy signal.
when RSI crossing below EMA/WMA/SMA its a sell signal.
Green Circle shows that RSI is crossing above EMA/WMA/SMA etc, which means it may be a likely Buy Signal.
Red Circle shows that RSI is crossing below EMA/WMA/SMA etc, which means it may be a likely Sell Signal.
Indicator 11
RSI with Bollinger bands
Bollinger bands and RSI complimenting each other and giving a Buy and Sell signal in below chart
if a security price reaches upper band of a Bollinger Band channel and also the RSI is above 70 (overbought), a trader can look for selling opportunities (reversal) (sell).
but in case price reaches upper band of a Bollinger Band channel but RSI is not above 70 (overbought), there may be chance that security remains in an uptrend, so a trader may wait before entering a sell position.
if a security price reaches lower band of a Bollinger Band channel and also the RSI is below 30 (oversold), a trader can look for buying opportunities (reversal) (buy).
but in case price reaches lower band of a Bollinger Band channel but RSI is not below 30 (oversold), there may be chance that security remains in an downtrend, so a trader may wait before entering a buy position.
so bollinger band with RSI can give a double confirmation on a reversal.
Buy Signal = If the RSI is below Green Horizontal line (Oversold zone) and also below Lower Bollinger Band it indicates that an upside reversal may come, which means that it may be a likely Buy Signal.
Sell Signal = If the RSI is above Red Horizontal line (Overbought zone) and also above Upper Bollinger Band it indicates that an Downside reversal may come, which means that it may be a likely Sell Signal.
Special Thanks to //© HoanGhetti for RSI Trendlines.
Limitations of the RSI:-
RSI works best in range bound market and is less trustworthy in trending markets.
So new traders may get trapped in an uptrend or a downtrend if they forget to see the overall long term trend of that security.
Traders should set stop loss and take profit levels as per risk reward ratio.
Note:
Don't confuse RSI and relative strength. RSI is changes in the price momentum of a security.
whereas relative strength compares the price performance of two or more securities.
Like other technical indicators, RSI also is not a holy grail. It can only assist you in building a good strategy. You can only succeed with proper position sizing, risk management and following correct trading Psychology (No overtrade, No greed, No revenge trade etc).
THIS INDICATOR OF RSI IS FOR EDUCATIONAL PURPOSE AND PAPER TRADING ONLY. YOU MAY PAPER TRADE TO GAIN CONFIDENCE AND BUILD FURTHER ON THESE. PLEASE CONSULT YOUR FINANCIAL ADVISOR BEFORE INVESTING. WE ARE NOT SEBI REGISTERED.
Hope you all like it
happy learning.

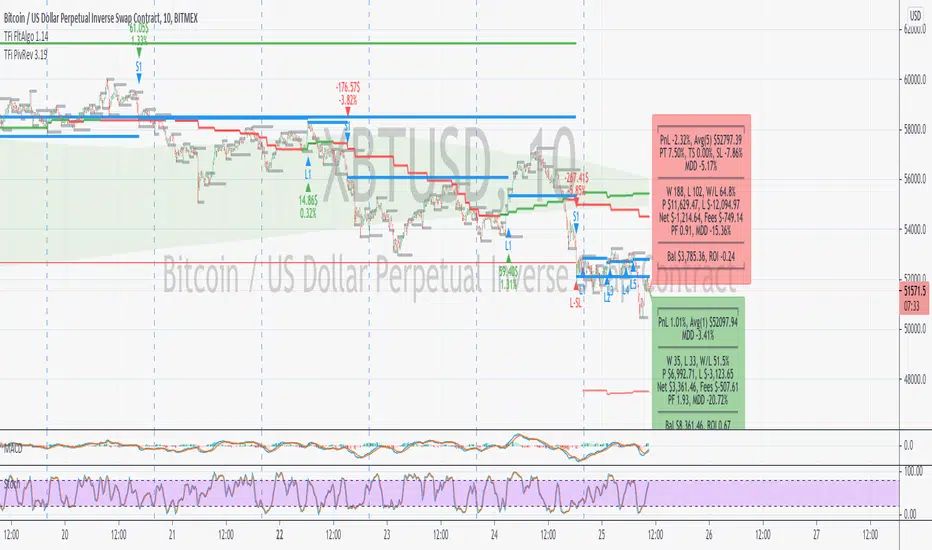
TFi Pivot Reversal V3The Pivot Reversal Study uses pivot points to create a support and resistance level; based on this levels the script creates virtual stop-market orders to catch the trend if the price is crossing the pivot lines.
A "Pyramiding" input allows to configure up to 3 entries; the script enters an additional position if the price falls by a configurable percentage amount (long), the reverse to short orders.
A configurable profit-target and stop-loss is being used to exit an open position.
An optional Moving Average filter can be used to enable only long or short positions.
The script renders a status box at the last bar, which shows the current position status and result of the built-in trading simulation results.
It shows the following statistic values:
current position PnL - also background turns green if position is in profit and red if in loss
the percentage distance to the profit-target and stop-loss level
the overall number of wins and losses and the win/loss ratio
the overall profit and loss amount (assuming a quantity of 1)
the net-profit and profit-ratio
For the correct simulation of entry/exit prices, the script contains inputs for a percentage entry and exit slippage.
The study also creates configurable alerts, which follow the exact position of the entry/exit markers. The default alert messages contain trading instruction to execute orders via Alertatron; but the message content can be replaced if configuring the alert in the Tradingview environment.
The script was mainly backtested with crypto-coins, e.g. XBTUSD at 15min timeframe. But the script also works with any other type of security and timeframe.
How to access
This strategy is a "Invite Only" script. You can can subscribe or purchase the strategy; please use the link below or send me a message via Tradingview to obtain access to the strategy and study script.
For enabling the script in your Tradingview chart window, click on "Indicators" and select "Invite-Only Scripts".
Full list of alerts
'Alertatron Exit' ... Exit all open positions.
'Alertatron Enter Long' ... Enter long position, w/o stop-loss being used.
'Alertatron Enter Short' ... Enter short position, w/o stop-loss being used.
'Alertatron Enter Long SL' ... Enter long position, w/ stop-loss being used.
'Alertatron Enter Short SL' ... Enter short position, w/ stop-loss being used.
Full list of parameters
"Pivot Left Bars" ... Number of bars on the left of the pivot point - used for pivot /peak detection.
"Pivot Right Bars" ... Number of bars on the right of the pivot point - used for pivot /peak detection.
"MA Filter Fast" ... Moving Average filter fast period.
"MA Filter Slow" ... Moving Average filter slow period.
"Profit Target Option" ... Configure the profit-target either as a fix percentage value or an ATR.
"Profit Target " ... Fix percentage profit-target.
"Profit ATR Period" ... ATR profit-target period.
"Profit ATR Factor" ... ATR profit-target factor/multiplier.
"Stop Loss Option" ... Configure the stop-loss either as a fix percentage value or disable the stop-loss completely.
"Stop Loss " ... Fix percentage stop-loss.
"Rebuy Loss " ... Percentage loss of the initial position before script enter a nw position in the same direction.
"Pyramiding" ... Maximum number of positions.
"Show MA Plots" ... Show/hide Moving average plots.
"Slippage Entry " ... Percentage slippage for entering a position.
"Slippage Exit " ... Percentage slippage for exiting a position.
"Statistic Label" ... Defines the position of the statistic label relatively to the last bar in the chart.
"Backtest Start" ... Backtest start time; area outside this timeframe will be grayed out.
"Backtest Stop" ... Backtest stop time; area outside this timeframe will be grayed out.
"Backtest Mode" ... Closes the currently opened position if chart switches to last bar; please only enable if backtesting, otherwise it leads to unwanted alerts.
MKAST V2 (monthly)PLEASE READ THE ENTIRE POST BEFORE PURCHASING & USING THE MKAST Algorithm. Saves you and me some time in emails and messages. :)
This is the NEW MONTHLY ACCESS Version of the MKAST
The MKAST Buy Sell Algorithm is a very specific strategy, cut down to its roots and made perfect for the volatile crypto market.
Many Algorithms focus only on one aspect, one side, one specific rule.
As you know, this is not how life, the market or anything else works.
MKAST combines many different aspects at the same time, scans multiple other Algorithms and comes to a conclusion based on over 1350 lines of code.
It is based on Divergences, Elliott Waves , Ichimoku , MACD , MACD Histogram, RSI , Stoch , CCI , Momentum, OBV, DIOSC, VWMACD, CMF and multiple EMAs.
Every single aspect is weighted into the decision before giving out an indication.
Most buy/sell Algorithms FAIL because they try to apply the same strategy to every single chart, which
are as individual as humans.
To conquer this problem, MKAST has a wide range of settings and variables which can be easily
modified.
To make it a true strategy, MKAST has as well settings for Take Profit Points, Multiple Entries and Stop
Losses. Everything with an Alert Feature of course.
I know from experience that many people take one Algorithm and are simply too LAZY to add multiple Algorithms to make a rational choice.
The result of that is that they lose money, by following blatantly only one Algorithm.
MKAST has additional 9 Indicators, perfect for the crypto market, which can be turned on and off.
Manual
MKAST Signals Settings
“Show Signals?” - On/Off to show the Buy/Sell Signals.
“Aggressiveness” - Increase to make the signals less aggressive and decrease to make them more aggressive.
“Show Custom Signals?” - On/Off to show custom MKAST Signals as chosen in the settings below.
“Custom Buy/Sell Aggressiveness” - Choose a custom Aggressiveness for each buy and sell signal individually.
“TJ-Index Requirement For Buy/Sell” - If the TJ-Index is below the given number, it will show the signal in grey, this also applies for normal signals. Buy 0 and Sell 15 shows all signals in their original colour again.
“Don’t show signals that don’t meet index requirement?” - Checked, it will completely not show signals which would be “grey” as in the explanation above.
“Change Backgroundcolour if index is at 15 or 0?” - Checked, changes the colour of the chart if the index is at 15 or 0 points
MKAST Panel Settings
“Show Info Panel?” - Shows Info Panel on the chart.
“Move Info Panel UP by %” - Moves Info Panel up/down.
“Move Info Panel Left/Right ” - Moves Info Panel Left/Right.
“Show BitMEX Panel?” - Shows BitMEX Panel on the chart.
“Move BitMEX Panel by % ” - Moves BitMEX Panel up/down.
“Move BitMEX Panel Left/Right” - Moves BitMEX Panel Left/Right. “Signal Source” - Choose source of candle open/close for Equity calculation.
“Leverage Used?” - Select the used Leverage for your strategy and Equity calculation.
“Fees Per Trade in % ” - Deducts these fees after each trade from Equity calculation.
“Round Current Profit Price?” - Rounds the number on the Panel. “Trading Periods ” - Choose a trading Period which will be used to calculate Period Equity.
“Show separations of each Trading Period?” - Show separations on the chart of each Trading Period.
The very new feature on Tradingview and obviously now as well on MKAST are Information Panels.
I have chosen to add an Info Panel and a BitMEX Price Panel into MKAST, to make live and even
backtesting easier.
With only one blink of an eye the user is able to see ALL relevant information, without having to go
through various ways of checking and using other tools.
The Info Panel:
The first row shows the current profit. This is calculated since the signal initiation and the current candle close. Followed by a single number, which represents the current TJ-Index, removing the need of having to add the actual TJ-Index Oscillator on the chart.
The second row shows the current position and its status. This was added on request of many users wanting to know if their position is “about to change” or not. The status shows the users if the position is “endangered” or “okay”.
Followed by the “backtesting tool” already included inside the Panel. No need for complex oscillators with a hard reading for backtesting. With this one and simple panel, you see the Period Equity for the period chosen previously in the settings. This calculates all profits made inside that period and re-sets when the period ends. Right next to it, the Total Equity calculating ALL profits since the beginning of the chart.
Right below, you see the information about the last long and short position which have been open. This helps with the evaluation and documentation of the last trade.
The BitMEX Panel:
A convenient panel which shows all BitMEX contracts and their LIVE prices. The need for opening each chart goes away, the quality and experience of trading increases.
MKAST custom Signals are one of the notorious possibilities for ADVANCED strategies with MKAST.
Users who requested these features and use them frequently are the ones, having already a very unique trading strategy and they use these very custom signals as confluence or for multiple entry trades.
These custom signals and their settings can be mostly ignored by the majority of traders who are using this Algorithm.
The idea behind the grey signals has its roots in the idea of the TJ-Index. The TJ-Index being 15 Algorithms and conditions possible showing a bullish or bearish interpretation. The index counts the Algorithms which are showing a bullish interpretation.
Like that we can make sure that signals are shown in the original colour, are only those who have an additional confluence with the TJ-Index, not letting the user buy, if at least the majority is not bullish , and not letting the user sell, if at least the majority is bearish .
The custom buy and sell aggressiveness lets the user customise the MKAST algorithm even more.
Either the users wants to see how signals are changing on a different (slightly lower or higher) aggressiveness, being able to expect a change on their own settings. OR seeing that some signals of the same sort are a little out of place and is able to move these to a different aggressiveness, increasing the profitability even more.
Needless to say, custom signals are NOT a part of the Info Panel.
MKAST Label & Trendline Settings
“Show Labels?” - On/Off to show Labels above each signal, with the percentage gain or loss, calculated from the last signal to the new signal.
“Show Trendlines?” - On/Off to show automatic Trendlines following Gainzy Lines.
“Lookback Length” - Choose a length that the automatic trendiness use for calculation. Comparable to Aggressiveness.
“Wicks//Bodies” - Change between trendiness connecting from wick to wick or from body to body.
“Black lines// Coloured lines” - Change between simply black lines or changing colour lines.
“Filter Trendlines?” - On/Off to show all trendiness or just resistance decreasing and support increasing ones.
“Limit Extensions Of The Lines?” - This value increases by how much the trendiness are being extended. 0 = endless extension, otherwise 100 = maximum custom extension.MKAST Strategy “Take Profit 1” - On/Off to show TP1 points.
“Take Profit After %” - Set the percentage after which TP1 is active.
“Take Profit 2 ” - On/Off to show TP2 points.
“Take Profit 2 After %” - Set the percentage after which TP1 is
active.
“Take Profit 3” - On/Off to show TP3 points.
“Take Profit 3 After %” - Set the percentage after which TP1 is active.
“Second Entry” - On/Off to show Second Entry points.
“Second Entry After %” - Set the percentage after which Second Entry is active.
“Third Entry” - On/Off to show Third Entry points.
“Third Entry After %” - Set the percentage after which Third Entry is active.
“Stop Loss” - On/Off to show Stop Loss points.
“Stop Loss After %” - Set the percentage after which Stop Loss is active.
MKAST Strategy
To make the life of the MKAST user even easier, I have added all adjustable Take Profit Points, Multiple entry points and Stop Loss points.
I have never seen a sustainable and reliable trading strategy without TPs, Multiple entry and especially without a stop loss. Everything in the usual and fully customisable MKAST style.
Simply choose how many Take Profit points you would like to have and choose the percentage after which you would like to see the Take Profit point appear on the chart and notify you to take profits.
Are you a Trader who likes Multiple Entries? Also no problem with MKAST. Select how many additional entries you would like to have and after how many percent you would like them to appear on the chart and remind you of adding to the position.
What would a Strategy be without a Stop Loss? Same settings apply here as on the TPs and MEs .
All of the settings are able to take fractions of a number as well. This enables users to even use all of the strategy settings for scalping or FX pairs, where high leverage and the smallest of moves are used for trading.
Needless to say, all of these settings work on RENKO and Heikin Ashi as well. These might need adjustment, since the calculation is different, yet there is nothing standing in the way of it anymore.
Crypto Modified Indicators
“Show Divergences?” - On/Off to show Divergences on the Chart based on the data of 10 different Algorithms.
“Show Oversold/bought?” - On/Off to change the colour of the chart in Oversold/bought conditions.
“Oversold/bought value?” - Choose a value for which the chart is Oversold/bought.
“Show Fibonacci Levels?” - On/Off to show automatic Fibonacci Levels.
“Fibonacci Lookback Lenght” - This value states how many candles from right now are taken into account to paint the Fibonacci Levels.
“Fibonacci Custom Period” - Choose a custom Timeframe that should be used to paint the Fibonacci Levels.
“2nd-7th Fibonacci Level” - Enter a value for the Fibonacci Levels you would like to use and see on the chart.
“Plot 1.618 Level?” - On/Off for the Fibonacci extension level.
Crypto Modified Indicators
“Show Bands?” - On/Off to show the TJ-Bands on the chart.
“Bands Length” - Choose a value for the TJ-Bands Lenght
“Show Show EMA 1-3?” - On/Off to show the EMAs 1-3 on the chart.
“EMA Lenght 1-3” - Choose a value for the first to third EMA Lenght
“Show Ichimoku? ” - On/Off to show Ichimoku on the chart.
“Show Tenkin?” - On/Off to show Tenkin on the chart. “Tenkin” - Set the lenght of the Tenkin.
“Show Kijun?” - On/Off to show Kijun on the chart.
“Kijun” - Set the lenght of the Kijun.
“Show Senkou?” - On/Off to show the Senkou on the chart. “Senkou” - Set the lenght of the Senkou.
“Displacement” - Set the value of the Displacement.
“Show Chikou Span?” - On/Off to show the Chikou Span on the chart.
Crypto Custom Indicators
In the picture above, you see the first pair of Crypto Custom Indicators. The oversold and overbought conditions are highlighted.
Bullish and Bearish divergences are also plotted on the chart.
This is personally my favourite combination of Indicators and MKAST settings. It shows nicely
everything one needs to know and makes it easier to decide wether to follow a signal or not.
We here as well a perfect example of the Automatic Fibonacci Lines (Lookback 50, Timeframe 1D).
It shows all significant levels, which we can see being respected.
Orange = 23.6%, Green = 38.2%, Red = 50%, Yellow = 61.8%, Blue = 78.6%, White = 0%;100%
In this picture above, we observe the perfect ensemble of MKAST and an EMA strategy, especially modified for crypto markets.
Here, as by default, we have the EMAs at 21, 90 and 200. These have shown to be very significant moving support and resistance points in the crypto market.
In this picture above, I lowered the timeframe to show the highly significant levels of the Ichimoku . It has not the “usual values”. These here have been modified for the volatile crypto market and set as default.
An incredibly powerful tool for anyone who is ready to step up their trading game. It is a huge part of the MKAST back end and the strategy behind it.
MKAST Custom Alerts
1
MKAST without any doubt has Custom Alerts for all Signals that it is painting on the chart.
One can even choose to receive custom notifications for Take Profit points, Multiple Entry points and
the Stop Loss points.
The signals appear on the chart DURING the candle, not at the end of the candle. Therefore, the
alerts do this as well. These appear during the candle.
Here we can see all of the possible Alerts that can be chosen to be displayed. In total it is 14 different custom alerts, based on what the trader is looking for and how he is trading.
Personally, I have 10-15 coins that I trade the most and for these I have custom notifications, mostly though only the MKAST Buy/Sell and Stop Loss Signals.
To activate Alerts for MKAST,
1) Go to the “ALERT” icon on the top tool bar of your Tradingview.
2) Select “CONDITION” as “—MKAST—“
3) Then choose ONE condition from the list of conditions.
4) On “OPTIONS” you can set how many times it appears, I have “Once per Bar”.
4.1) If you want to make sure that the signal is truly there and not just a condition for a second during the candle, choose “ONCE PER BAR CLOSE”.
5) “Expiration Time” sets the time until the alert expires. PRO users have no expiration for alerts.
6) “Alert Actions” give you a row of choices what happens and how you want to be notified.
7) “Message” is the message that you receive inside the notification.
Thank you, Kong

MKAST V2 (lifetime)PLEASE READ THE ENTIRE POST BEFORE PURCHASING & USING THE MKAST Algorithm. Saves you and me some time in emails and messages. :)
This is the NEW LIFETIME ACCESS Version of the MKAST
The MKAST Buy Sell Algorithm is a very specific strategy, cut down to its roots and made perfect for the volatile crypto market.
Many Algorithms focus only on one aspect, one side, one specific rule.
As you know, this is not how life, the market or anything else works.
MKAST combines many different aspects at the same time, scans multiple other Algorithms and comes to a conclusion based on over 1350 lines of code.
It is based on Divergences, Elliott Waves, Ichimoku, MACD, MACD Histogram, RSI, Stoch, CCI, Momentum, OBV, DIOSC, VWMACD, CMF and multiple EMAs.
Every single aspect is weighted into the decision before giving out an indication.
Most buy/sell Algorithms FAIL because they try to apply the same strategy to every single chart, which
are as individual as humans.
To conquer this problem, MKAST has a wide range of settings and variables which can be easily
modified.
To make it a true strategy, MKAST has as well settings for Take Profit Points, Multiple Entries and Stop
Losses. Everything with an Alert Feature of course.
I know from experience that many people take one Algorithm and are simply too LAZY to add multiple Algorithms to make a rational choice.
The result of that is that they lose money, by following blatantly only one Algorithm.
MKAST has additional 9 Indicators, perfect for the crypto market, which can be turned on and off.
Manual
MKAST Signals Settings
“Show Signals?” - On/Off to show the Buy/Sell Signals.
“Aggressiveness” - Increase to make the signals less aggressive and decrease to make them more aggressive.
“Show Custom Signals?” - On/Off to show custom MKAST Signals as chosen in the settings below.
“Custom Buy/Sell Aggressiveness” - Choose a custom Aggressiveness for each buy and sell signal individually.
“TJ-Index Requirement For Buy/Sell” - If the TJ-Index is below the given number, it will show the signal in grey, this also applies for normal signals. Buy 0 and Sell 15 shows all signals in their original colour again.
“Don’t show signals that don’t meet index requirement?” - Checked, it will completely not show signals which would be “grey” as in the explanation above.
“Change Backgroundcolour if index is at 15 or 0?” - Checked, changes the colour of the chart if the index is at 15 or 0 points
MKAST Panel Settings
“Show Info Panel?” - Shows Info Panel on the chart.
“Move Info Panel UP by %” - Moves Info Panel up/down.
“Move Info Panel Left/Right ” - Moves Info Panel Left/Right.
“Show BitMEX Panel?” - Shows BitMEX Panel on the chart.
“Move BitMEX Panel by % ” - Moves BitMEX Panel up/down.
“Move BitMEX Panel Left/Right” - Moves BitMEX Panel Left/Right. “Signal Source” - Choose source of candle open/close for Equity calculation.
“Leverage Used?” - Select the used Leverage for your strategy and Equity calculation.
“Fees Per Trade in % ” - Deducts these fees after each trade from Equity calculation.
“Round Current Profit Price?” - Rounds the number on the Panel. “Trading Periods ” - Choose a trading Period which will be used to calculate Period Equity.
“Show separations of each Trading Period?” - Show separations on the chart of each Trading Period.
The very new feature on Tradingview and obviously now as well on MKAST are Information Panels.
I have chosen to add an Info Panel and a BitMEX Price Panel into MKAST, to make live and even
backtesting easier.
With only one blink of an eye the user is able to see ALL relevant information, without having to go
through various ways of checking and using other tools.
The Info Panel:
The first row shows the current profit. This is calculated since the signal initiation and the current candle close. Followed by a single number, which represents the current TJ-Index, removing the need of having to add the actual TJ-Index Oscillator on the chart.
The second row shows the current position and its status. This was added on request of many users wanting to know if their position is “about to change” or not. The status shows the users if the position is “endangered” or “okay”.
Followed by the “backtesting tool” already included inside the Panel. No need for complex oscillators with a hard reading for backtesting. With this one and simple panel, you see the Period Equity for the period chosen previously in the settings. This calculates all profits made inside that period and re-sets when the period ends. Right next to it, the Total Equity calculating ALL profits since the beginning of the chart.
Right below, you see the information about the last long and short position which have been open. This helps with the evaluation and documentation of the last trade.
The BitMEX Panel:
A convenient panel which shows all BitMEX contracts and their LIVE prices. The need for opening each chart goes away, the quality and experience of trading increases.
MKAST custom Signals are one of the notorious possibilities for ADVANCED strategies with MKAST.
Users who requested these features and use them frequently are the ones, having already a very unique trading strategy and they use these very custom signals as confluence or for multiple entry trades.
These custom signals and their settings can be mostly ignored by the majority of traders who are using this Algorithm.
The idea behind the grey signals has its roots in the idea of the TJ-Index. The TJ-Index being 15 Algorithms and conditions possible showing a bullish or bearish interpretation. The index counts the Algorithms which are showing a bullish interpretation.
Like that we can make sure that signals are shown in the original colour, are only those who have an additional confluence with the TJ-Index, not letting the user buy, if at least the majority is not bullish, and not letting the user sell, if at least the majority is bearish.
The custom buy and sell aggressiveness lets the user customise the MKAST algorithm even more.
Either the users wants to see how signals are changing on a different (slightly lower or higher) aggressiveness, being able to expect a change on their own settings. OR seeing that some signals of the same sort are a little out of place and is able to move these to a different aggressiveness, increasing the profitability even more.
Needless to say, custom signals are NOT a part of the Info Panel.
MKAST Label & Trendline Settings
“Show Labels?” - On/Off to show Labels above each signal, with the percentage gain or loss, calculated from the last signal to the new signal.
“Show Trendlines?” - On/Off to show automatic Trendlines following Gainzy Lines.
“Lookback Length” - Choose a length that the automatic trendiness use for calculation. Comparable to Aggressiveness.
“Wicks//Bodies” - Change between trendiness connecting from wick to wick or from body to body.
“Black lines// Coloured lines” - Change between simply black lines or changing colour lines.
“Filter Trendlines?” - On/Off to show all trendiness or just resistance decreasing and support increasing ones.
“Limit Extensions Of The Lines?” - This value increases by how much the trendiness are being extended. 0 = endless extension, otherwise 100 = maximum custom extension.MKAST Strategy “Take Profit 1” - On/Off to show TP1 points.
“Take Profit After %” - Set the percentage after which TP1 is active.
“Take Profit 2 ” - On/Off to show TP2 points.
“Take Profit 2 After %” - Set the percentage after which TP1 is
active.
“Take Profit 3” - On/Off to show TP3 points.
“Take Profit 3 After %” - Set the percentage after which TP1 is active.
“Second Entry” - On/Off to show Second Entry points.
“Second Entry After %” - Set the percentage after which Second Entry is active.
“Third Entry” - On/Off to show Third Entry points.
“Third Entry After %” - Set the percentage after which Third Entry is active.
“Stop Loss” - On/Off to show Stop Loss points.
“Stop Loss After %” - Set the percentage after which Stop Loss is active.
MKAST Strategy
To make the life of the MKAST user even easier, I have added all adjustable Take Profit Points, Multiple entry points and Stop Loss points.
I have never seen a sustainable and reliable trading strategy without TPs, Multiple entry and especially without a stop loss. Everything in the usual and fully customisable MKAST style.
Simply choose how many Take Profit points you would like to have and choose the percentage after which you would like to see the Take Profit point appear on the chart and notify you to take profits.
Are you a Trader who likes Multiple Entries? Also no problem with MKAST. Select how many additional entries you would like to have and after how many percent you would like them to appear on the chart and remind you of adding to the position.
What would a Strategy be without a Stop Loss? Same settings apply here as on the TPs and MEs.
All of the settings are able to take fractions of a number as well. This enables users to even use all of the strategy settings for scalping or FX pairs, where high leverage and the smallest of moves are used for trading.
Needless to say, all of these settings work on RENKO and Heikin Ashi as well. These might need adjustment, since the calculation is different, yet there is nothing standing in the way of it anymore.
Crypto Modified Indicators
“Show Divergences?” - On/Off to show Divergences on the Chart based on the data of 10 different Algorithms.
“Show Oversold/bought?” - On/Off to change the colour of the chart in Oversold/bought conditions.
“Oversold/bought value?” - Choose a value for which the chart is Oversold/bought.
“Show Fibonacci Levels?” - On/Off to show automatic Fibonacci Levels.
“Fibonacci Lookback Lenght” - This value states how many candles from right now are taken into account to paint the Fibonacci Levels.
“Fibonacci Custom Period” - Choose a custom Timeframe that should be used to paint the Fibonacci Levels.
“2nd-7th Fibonacci Level” - Enter a value for the Fibonacci Levels you would like to use and see on the chart.
“Plot 1.618 Level?” - On/Off for the Fibonacci extension level.
Crypto Modified Indicators
“Show Bands?” - On/Off to show the TJ-Bands on the chart.
“Bands Length” - Choose a value for the TJ-Bands Lenght
“Show Show EMA 1-3?” - On/Off to show the EMAs 1-3 on the chart.
“EMA Lenght 1-3” - Choose a value for the first to third EMA Lenght
“Show Ichimoku? ” - On/Off to show Ichimoku on the chart.
“Show Tenkin?” - On/Off to show Tenkin on the chart. “Tenkin” - Set the lenght of the Tenkin.
“Show Kijun?” - On/Off to show Kijun on the chart.
“Kijun” - Set the lenght of the Kijun.
“Show Senkou?” - On/Off to show the Senkou on the chart. “Senkou” - Set the lenght of the Senkou.
“Displacement” - Set the value of the Displacement.
“Show Chikou Span?” - On/Off to show the Chikou Span on the chart.
Crypto Custom Indicators
In the picture above, you see the first pair of Crypto Custom Indicators. The oversold and overbought conditions are highlighted.
Bullish and Bearish divergences are also plotted on the chart.
This is personally my favourite combination of Indicators and MKAST settings. It shows nicely
everything one needs to know and makes it easier to decide wether to follow a signal or not.
We here as well a perfect example of the Automatic Fibonacci Lines (Lookback 50, Timeframe 1D).
It shows all significant levels, which we can see being respected.
Orange = 23.6%, Green = 38.2%, Red = 50%, Yellow = 61.8%, Blue = 78.6%, White = 0%;100%
In this picture above, we observe the perfect ensemble of MKAST and an EMA strategy, especially modified for crypto markets.
Here, as by default, we have the EMAs at 21, 90 and 200. These have shown to be very significant moving support and resistance points in the crypto market.
In this picture above, I lowered the timeframe to show the highly significant levels of the Ichimoku. It has not the “usual values”. These here have been modified for the volatile crypto market and set as default.
An incredibly powerful tool for anyone who is ready to step up their trading game. It is a huge part of the MKAST back end and the strategy behind it.
MKAST Custom Alerts
1
MKAST without any doubt has Custom Alerts for all Signals that it is painting on the chart.
One can even choose to receive custom notifications for Take Profit points, Multiple Entry points and
the Stop Loss points.
The signals appear on the chart DURING the candle, not at the end of the candle. Therefore, the
alerts do this as well. These appear during the candle.
Here we can see all of the possible Alerts that can be chosen to be displayed. In total it is 14 different custom alerts, based on what the trader is looking for and how he is trading.
Personally, I have 10-15 coins that I trade the most and for these I have custom notifications, mostly though only the MKAST Buy/Sell and Stop Loss Signals.
To activate Alerts for MKAST,
1) Go to the “ALERT” icon on the top tool bar of your Tradingview.
2) Select “CONDITION” as “—MKAST—“
3) Then choose ONE condition from the list of conditions.
4) On “OPTIONS” you can set how many times it appears, I have “Once per Bar”.
4.1) If you want to make sure that the signal is truly there and not just a condition for a second during the candle, choose “ONCE PER BAR CLOSE”.
5) “Expiration Time” sets the time until the alert expires. PRO users have no expiration for alerts.
6) “Alert Actions” give you a row of choices what happens and how you want to be notified.
7) “Message” is the message that you receive inside the notification.
Thank you, Kong

Backtest PRO Suite+ (Plug & Play)Hello traders
I. SCRIPTS ACCESS AND TRIALS
1. For the trial request access, they have to be done through my website .
2. My website URL is in this script signature at the very bottom (you'll have to scroll down a bit and going past the long description) and in my profile status available here : Daveatt
Due to the new scripts publishing house rules, I won't mention the URL here directly. As I value my partnership with TradingView very much, I prefer showing you the way for finding them :)
3. Many video tutorials explaining clearly how all our indicators work are available on your website > guides section.
4. You may also contact me directly for more information
II. Backtest PRO Suite+ (Plug & Play)
2.1 Forewords
This indicator is available only to our PRO 12 months users. YES! I said indicator, and not strategy or backtest for an excellent reason.
We wanted to make it as generic as possible and allow anyone to connect any indicator of his/her choice in a few clicks only.
This is NOT possible (in TradingView) with a strategy/backtest, but only with an indicator - that's why we worked on recoding the whole backtest logic as an indicator.
The PRO edition does not handle any pyramiding/re-entry - as such enters only once per trend by design. This feature is reserved for our PREMIUM users.
2.2 🔎 Concept 🔎
This is an indicator that I saw on TradingView and was introduced by the @Pinecoders account on TradingView.
I inspired myself from his Backtest Engine to offer a version more adapted to my vision - The benefits of connecting yourself any indicator to our Backtest engine are amazing and huge.
The concept can't be more simple. Imagine using any indicator and connecting to a backtest system in a single click.
You may connect your Algorithm Builder also to this complete backtesting system in a single click.
What's better between paying thousands for a backtest, or connecting yourself your indicator to your backtest with a click?
That was a rhetoric question, but you can still share your answer with me if you want to :)
III. The amazing benefits of our🔌&🕹️ (Plug&Play) system
Issue #1 💲 A BACKTEST SYSTEM IS COSTLY 💲
Hiring a developer to code a custom indicator is costly. For a custom backtest it's even more expensive as those scripts are very often way more complicated.
Now imagine, that now that you see your idea live on a chart, you'll realize you'll have to finance another backtest system, as the one you have is not compatible with your new idea.
Solution #1 💲💲 YOU COULD BE SAVING SOME MONEY 💲💲
just because it won't be needed to hire someone else for each of your trading idea.
We will never guarantee your success on the market, but THIS I stand by it any day any hour.
You can connect any indicator or your choice by updating your indicator slightly and connecting it to our Backtest engine. We send the tutorial for doing it to all our customers.
Issue #2 🕔 IT'S TIME-CONSUMING 🕔
Even if someone is doing all the coding for you, it might require days/weeks depending on your overall trading strategy/idea.
Without even counting the time for you to test/validate the work done and all the back-and-forth to fix all the issues.
Solution #2 SAVING TIME MIGHT EQUATES TO SAVING MONEY : 🕔 = 💲💲💲
I wish it could be as easy as going from weeks of coding to "1 single click" :)
I did the heavy-lifting, but you'll have to make the last effort the cross the finishing line. I made it easy for you to play with it and find a configuration that makes sense to YOU and for your strategy/asset/timeframe
Issue #3 ❌ IT'S COMPLICATED ❌
Someone did a backtest code for you, but... you can't update it because you either :
- don't know anything in programming
- ... and don't have time to learn (most of us have a job/family/...life)
- The system you have is way too specific for one of your previous idea, but can't be updated easily for your next trading ideas. I see a lot of traders nodding right now thinking "that's soooooo true !!!!"
Solution #3 🎉 WE MADE IT EASY AND FUN 🎉
Our goal is to externalize the technical stuff that you don't want to take care of - so that you can finally focus on your trading and optimizing your ideas. #bold #statement
In case you're wondering, no we're not reading your mind :), but we're also traders who didn't know how to code before and had to hire external programmers to do the heavy work for us.
You can be sure that most of the frustrations (trading, technical, ...) you have/had, we had them also and that's why we created this backtest indicator.
III. 🔌&🕹️
Hope you're ready to be impressed. Because, what I'm about to introduce, is my best-seller feature - and available across many of my indicators.
In TradingView, there is a feature called "Indicator on Indicator" meaning you can use an external indicator as a data source for another indicator.
I'm using that feature to connect any external indicator to our Backtest PRO Suite+ (Plug & Play) - hence the plug and play name. Please don't make it a plug and pray :) it's supposed to help you out, not to stress you even more
Let's assume you want to connect your Algorithm Builder Single Trend+ to your Backtest PRO Suite+
I mentioned an Algorithm Builder but you may connect any oscillator (MACD, On balance volume, stochastic RSI, True Strenght index, and many more..) or non-oscillator (divergence, trendline break, higher highs/lower lows, candlesticks pattern, price action, harmonic patterns, ...) indicators.
THE SKY IS (or more likely your imagination) is the limit :)
Fear no more. The Plug&Play technology allows you to connect it and use it the backtest calculations.
This is not magic, neither is sorcery, but certainly is way beyond the most awesome thing I've ever developed on TradingView (even across all brokers I know). #bolder #statement
TradingView is the best trading platform by far and I'm very grateful to offer my indicators on their website.
To connect your external indicator to ours, we're using a native TradingView feature, which is not available for all users.
It depends on your TradingView subscription plan ( More info here )
If you intend to use our Algorithm Plug&Play indicator, and/or our Backtest Plug&Play suites, then you must upgrade your TradingView account to enjoy those features.
We value our relationship with our customers seriously, and that's why we're warning you that a compatible TradingView account type is required - at least PRO+ or PREMIUM to add more than 1 Plug&Play indicator per account.
We go in-depth on our website why the Plug&Play is an untapped opportunity for many traders out there - URL available on my profile status and signature
IV. 📊 Make it nice! 📊
Now we're getting right into the fun stuff.
Let's explore briefly each display option (symbolized by a 👁️🗨️ in the Backtest UI) :
- Color Traded Background : Color the chart background is green when in a BUY trade, in red when in a SELL trade. If the Backtest is not in a trade, then the background won't be colored.
- Show Entry/Exit Markers : Displays the entries (Enter Long/Enter Short), and exits (Exit Long/Exit Short) labels.
- Show Entry Level :Displays a blue level line to easily identify the entry price of a trade.
- Show Take Profit Level : Display a purple line to visualize where the Take Profit level is (we'll explain below how to set it up).
- Show In-Trade Stops : Display the stop-loss
V. Backtesting filters
A backtest should have some filters helping the traders testing a few hypotheses. Well.... we included a ton of them - even for the PRO version
Once again, thank you @Pinecoders for the help and support you gave me
5.1 ▄ █ Position sizing █ ▄
- 1. % of Equity: If selected, the position size used is the input to the right of 1. % of Equity.
Example: The trader starts with a capital of 100K. After a winning trade, your total capital is $103K - for the next trade the position size will be 3% of $103K
- 2. % of Capital: If selected, the position size used is the input to the right of 2. % of Capital.
In other words, the position size will always be the same position size as calculated on the initial capital.
Example: The trader starts with a capital of 100K. After a winning trade, your total capital is $103K - for the next trade the position size will be 5% of $100K. (As 100K is the initial capital used in our dummy example)
5.2⛔ Entry Stops and In-Trade Stops ⛔
We didn't reinvent the wheel here. Any good backtest should offer an entry stop-loss and an in-trade stop-loss.
Giving only here also an example among all the use cases. For instance, the trader sets a stop-loss 2% at the time of entry on your trade, but once the trade moves in the desired direction, the trader might want a trailing stop-loss using a 4% input.
Example: A trader goes LONG on only 1 "ABC" stock evaluated $10 per share.
1) The entry-stop loss will be 2% away so set at $8
2) A candle
3) The trailing stop will activate, and move the stop-loss from the entry stop-loss level (=$8) to $8.32 (=4% move up from $8) - and so on, and so forth for each time the price moves 4% up
The entry and in-trade stop losses can absolutely be identicals. There is no universal rule, and as always you know the drill - all depends on your backtest, and indicator configurations as a whole.
Last, but not the least, selecting an Entry stop-loss is mandatory, but the in-trade stop-loss is not. Up to you to decide if the in-trade SL is needed for your Backtest strategy.
5.3 ❌ Hard Exits ❌
We included the MACD hard exit indicator in the backtest - as we did also for the Algorithm Builders.
The hard exit (or invalidation) is a fundamental part of my trading method.
I explained numerous times on TradingView, our website, and social media channels why I "love" this concept so much, and how it saved my trading account numerous times from getting savagely wrecked by the market.
5.4 💲💲 Take Profit 💲💲
We only included 1 level of Take Profit so far. We'll work on adding at least one more soon.
You can set your Take Profit level based on either a:
1- Fixed value
2 - Percentage value
5.5 📆 Date Range Filtering 📆
If enabled, the backtest only uses the data between the starting and the ending dates of the defined range.
5.6 ❗❗ Fees and Slippage ❗❗
Too often completely ignored by many traders, the fees can eat gains out quickly/deepen one's capital faster than expected.
⚠️The fees vary between brokers, and asset traded - it could be recommended to check on your broker page what are the fees for the asset on your chart, and insert that percentage number.
Another cost ignored, even more, is the Slippage.
i.e. think about a Stop-Loss being hit, and we're so confused because we see on the chart that NEVER the price came even close to your SL level, but... it got hit anyway.
Yes! we know how frustrating it is, but that's the game we're playing, and trading should never be about blaming the game, but only blaming the players/traders/ourselves.
Blaming the game constantly is likely to not end with good performance results, but accounting for this "risk", and being able to quantify it is an incredible hedge. #bold #statement #level #10000
5.7 🔔 Alerts 🔔
By design, the alerts aren't available for strategy scripts. But this script is an... indicator so why should we not enjoy all the cards in our hands the fullest.
We enabled the alerts on those Backtest Entry/Exit signals. You're welcome :)
VI. 📝 Where are the backtest results? 📝
Answer: in the Data Window section of your TradingView
Now the cherry on the cake if we might say so. A backtest is cool, but visualizing results is actually the end goal here.
The Data Window is dynamic - it means whenever you'll mouseover at a give time on your chart, the data on that panel automatically updates.
Let's assume you're backtesting your idea between Sept 1st, 2019, and Oct 1st, 2019.
If your mouse cursor is located (or hovered) at a candle on Sept 14th, 2019 (data chosen randomly for this example), then the data displayed only includes the results between Sept 1st, and Sept 14th.
More info available on our website with a nice tutorial video. Data window metrics and filters explained on our website
Here's what the data window looks like: imgur.com
If you have any doubt or question, please hit me up directly or ask in the comments section of this script.
I'll never claim I have the best trading methodology or the best indicators.
You only will judge and I'll appreciate all the questions and feedback you're sending my way.
They help me a ton to develop indicators based on all the requests I received.
Kind regards,
Dave
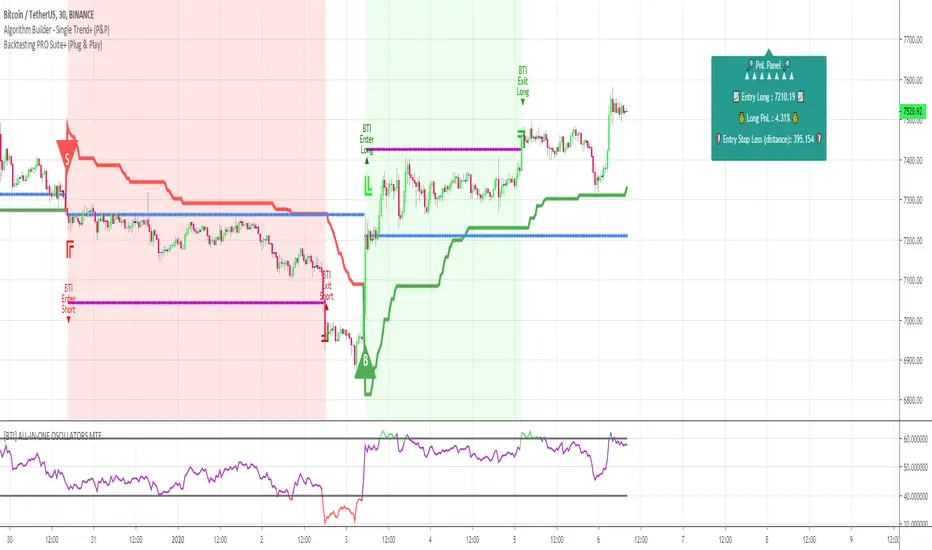
Algorithm Builder - Single Trend+ (Plug&Play)Hello traders
I. SCRIPTS ACCESS AND TRIALS
1. For the trial request access, they have to be done through my website .
2. My website URL is in this script signature at the very bottom (you'll have to scroll down a bit and going past the long description) and in my profile status available here : Daveatt
Due to the new scripts publishing house rules, I won't mention the URL here directly. As I value my partnership with TradingView very much, I prefer showing you the way for finding them :)
3. You may also contact me directly for more information
II. Algorithm Builder - Single Trend+ Plug&Play
2.1 Concept
That script is an upgrade of the Single Trend:
The Algorithm Builder - Single Trend+ (Plug & Play) is made to detect the convergence of many unrelated indicators, and give a BUY or SELL signal whenever all the selected sub-indicators are converging in the same direction.
The Single Trend+ (Plug & Play) gives one single entry per identified trend - unlike the Multiple Trends editions (also available on my scripts page) which may give more than 1 entry per trend.
The traders select the sub-indicators they want, and see in real-time the BUY and SELL triangles being updated.
III. Plug & Play
Hope you're ready to be impressed. Because, what I'm about to introduce, is my best-seller feature - and available across many of my indicators.
In TradingView, there is a feature called "Indicator on Indicator" meaning you can use an external indicator as a data source for another indicator.
I'm using that feature to connect any external indicator to our Algorithm Builder Single Trend+ Plug & Play (hence the plug and play name).
Let's assume you have your RSI divergence indicator - which is not part of the Algorithm Builder - but noticed that the convergence of an RSI divergence and a MACD gives strong signals.
I mentioned an RSI divergence, but you may connect any oscillator (MACD, On balance volume, stochastic RSI, True Strenght index, and many more..) or non-oscillator (divergence, trendline break, higher highs/lower lows, candlesticks pattern, price action, harmonic patterns, ...) indicators.
Any indicator that displays visual signals are eligible for this feature .... in other words.... all possible indicators. You're welcome :)
THE SKY IS (or more likely your imagination) is the limit :)
Fear no more. The Plug&Play technology allows you to connect it and use it in the convergence/confluence calculations.
Hence, whenever the MACD and RSI divergence will be in the same direction for the first time, you'll get a signal. For the first time only because this is a Single trend edition - you may enter multiple times using our Algorithm Builders - Multiple Trends editions.
To connect your external indicator to ours, we're using a native TradingView feature, which is not available for all users.
It depends on your TradingView subscription plan ( More info here )
If you intend to use our Algorithm Plug&Play indicator, and/or our Backtest Plug&Play suites, then you must upgrade your TradingView account to enjoy those features.
We value our relationship with our customers seriously, and that's why we're warning you that a compatible TradingView account type is required - at least PRO+ or PREMIUM to add more than 1 Plug&Play indicator per account.
We go in-depth on our website why the Plug&Play is an untapped opportunity for many traders out there - URL available on my profile status and signature
IV. Why the Algorithm Builder Single Trend+ (Plug&Play) may help you
I worked with many traders during my career, and their feedback about trading is often pretty similar.
They all tried a lot of complicated indicators, losing their capital, and finally getting back to the basics (even to the basic indicators if I might say)
The art is finding a good combination of indicators and setting strict money/risk management rules.
Easy in concept, but more than 90+% of traders lose money on the markets... which teach us that trading is not only about drawing trendlines, or using cool indicators but finding ways to ease our psychology while trading.
4.1 The Algorithm Builder trading framework
The sub-indicators (full list on our website) weren't chosen randomly. They're based on a trading method we've developed over the last 6 years - while working with traders and other trading quants.
The Algo Builders are made to detect a convergence - and as such, will give a signal once a trend has been identified.
They're not made to detect reversal but have been designed to give a signal when all sub-indicators are either ALL bullish (green) or ALL bearish (red).
We provide a framework based on indicators we selected because they:
1. make sense to be used altogether
2. work on asset classes like INDEX, CRYPTO, STOCK OPTIONS, FOREX, COMMODITIES
3. it may expand your knowledge about what detecting a convergence with pre-selected indicator really means
4.2 Supports and Resistances
The indicator displays the main algorithmic supports and resistances according to our trading method.
I think they're relevant for all asset classes, but you're absolutely free to use any different supports/resistances logic if you want to.
I'm not against it because I know that pivots, Fibonacci levels, etc. may work very well also.
4.3 Choose your favorite risk management algorithm
1/ Pre-defined Algo S/R method using:
- a supertrend of the stop-loss
- the nearest algorithmic resistances for the take profit levels.
2/ Define your own Stop-loss and Take-profits level in real-time
Stop-Loss Management
For what's following, let's assume that 2 is the stop-loss value you inserted in the indicator, and the Algorithm Builder gives a BUY signal.
This is NOT a recommendation at all, only an example to explain how this feature works.
- %Trailing: The Stop-Loss starts 2% away from the entry price - and will move up (because we're on a BUY trade as per our example) every time your trade will gain 2% profit
- Percentage: The Stop-Loss stays static 2% away from the entry price. There is no trailing here
- TP Trailing: This is a very awesome feature. The stop-loss is set 2% away when the trades start.
When the TP1 is hit, the stop-loss will be moved to the Entry price (also called breakeven).
When the TP2 is hit, the SL is moved to the previous TP1 position
- Fixed: Set the Stop-Loss at a fixed position (value should be in currency/units)
Take Profits Management
You can manage up to 2 take profit levels defined as a percentage or price value.
The expected input is in percentage value (for instance, setting the % target of TP1 to 2% will set the TP1 level 2% away from the entry price
4.4 Built-in Trade Manager
This is very likely the most loved utility script that we shared on TradingView.
It's included in your Algorithm Builder - Single Trend+, and will certainly help you immensely to analyze your charts and your trades.
We made sure that all the graphical elements on the chart will be updated in real-time whenever our user change anything on the indicator configuration.
You'll also be able to change the Trade Manager labels positions as you wish :)
4.5 Built-in Risk-to-Reward Panel
The good stuff doesn't stop here.
You'll notice that this sometimes green (when in a LONG), sometimes red (when in a SHORT) panel at the right of your chart.
It displays for the selected trading algorithmic (see 2.3.2 above), a ton of useful real-time analytics.
- Entry Price: the price when the Algorithm Builder will give a signal.
- The Trade PnL in percentage.
- Entry Stop Loss: Distance (in currency/units) between the selected stop-loss algorithm (percent, trailing, TP trailing, etc.) and the entry price.
- Entry TP1: Distance (in currency/units) between the entry price and the first take profit
- Entry TP2: Distance (in currency/units) between the entry price and the second take profit
- Risk/Reward TP1: Using the Stop-loss distance at entry, and Take Profit 1 at entry to compute the risk-to-reward ratio.
- Risk/Reward TP2: Using the Stop-loss distance at entry, and Take Profit 2 at entry to compute the risk-to-reward ratio.
For more details, please check the guides section of my website. Links are in my signature and profile status.
4.6Hard Exits
Our trading method is known for the hard exits, also called invalidation.
The Single Trend+ includes a hard exit based on a MACD - settings are flexible and you may update them.
Having a stop-loss protecting your trade is a best practice - Protecting your stop-loss also from getting hit is incredible.
We prefer invalidate a few positions, even if sometimes we don't want to. Rather than the market hard exiting on us, and leaving with our hard-working money.
4.7 Alerts
Alerts are enabled for:
- BUY/SELL triangles signals
- Trade Manager (SL, TP1, TP2)
- Hard Exits
V. Pain points that we're trying to solve with our Algorithm Builders
Issue #1 There are many informations / indicators / strategies / backtests / noise. Finding the right ones is not a simple task.
Solution #1 A reliable system that removes the external noise is much needed in trading to stay "in the game".
Issue #2 Trading could be quite stressful - The majority doesn't lose in trading because technical analysis is hard, but because managing our psychology is one of the hardest things a human can do.
Solution #2 Some ways to reduce the "trading stress" could be: getting better quality signals and trading like a "machine". Forgetting about Twitter and trusting the system you designed.
Issue #3 Trading without strict rules and only based on what we feel, or what we think the market should do is the fastest way to kiss our money goodbye.
Only 1 indicator generally is not enough. Traders generally use a combination of several indicators but they're monitoring them individually.
It's normal then to feel exhausted at the end of the day ^^ (to say the least)... and exhaustion leads to mistakes which leads to..... (I'm sure you got it) ... capital loss.
Solution #3 As a trader, I needed a trading framework and a method. I offer our trading method but they're plenty others out there. We cannot claim obviously it's the best ever ....but let's say we're using those exact same
scripts ourselves for our trading. And this what we've been recommending our clients to trade with for the past years. Also, having a tool detecting the convergence of several indicators and giving 1 unique signal
for BUY/SELL position will save you a lot of time/energy, and perhaps might help you out getting better trading performance.
VI. Resolving a complex puzzle and having fun in the process
Trading has to stay a passion and not (only be) a source of intense stress.
The most successful traders I know are "trading geeks" - literally always looking for optimizing, searching for the best possible entries, setups, indicators, tools, etc.
For them, it's not even about the money anymore, but only about beating their previous performance.
Why are they doing this? Because it's fun
Might appears as a bold statement, but I guarantee that looking for setups is fun.
One of our users even told us, that it's like playing with "Legos" and we couldn't possibly agree more.
VII. Designing a system that "makes sense"
Another bold statement now. Brace yourselves ladies and gentlemen
The Algorithm Builders allow to design trading systems quickly. What could takes days/weeks/months to find out... might be now within your reach in less than a few hours.
With a bit of practice, less than an hour might be enough per asset/timeframe to find a system that makes sense to you and adapted to your trading capital and psychology.
Assuming our users read our guides and are fully committed to learning a new way of trading - then we do guarantee you'll be able to design kick-ass trading systems that make sense.
"Making sense" doesn't mean at all it's guaranteed to win, it means you're the one defining the convergence of indicators, using your Algorithm Builder, and observe that most of the time - whenever there is a BUY signal, the candlesticks are going upwards - whenever there is a SELL signal, it's going downwards.
This is a necessary step to make real progress from a trading analyst perspective - and hopefully could lead to profits.
VII. Algorithm Builder versus the main trader enemy(=psychology)
This indicator has the goal to help solving one of the MAIN issues encountered by traders.
Most of traders realize, they can't perform with only 1 indicator (or 1 price pattern or 1 price action) and need a combination of multiple indicators before getting in a trade.
Far from being a magic pill, if it could at least reduce the stress you have while trading, then we'll consider we made a great job - it's a technical "useless noise remover", and needs to be followed strictly.
Such trust in a trading system can only be built by testing your Algorithm Builder configuration on either:
1. a demo account
2. or a live account with small bids. And then, increasing progressively the bids if your capital increases progressively.
Though, you should still use your common sense. (for instance: if we get a BUY signal right on a big timeframe resistance we're hitting for the first time).
I'm aware this is a new way of trading but for many, and while we cannot foresee the future, neither predict performance, we believe it might save you a lot of time to find good signals.
My maximum level of happiness will be reached the day when our users will contact me and showing me setups being mine.
I'm sure that even I can learn from my users and, we can all learn from each other Algorithm Builder configuration
VIII. What is a wrong or bad configuration?
Simply put. If you see that most of your signals react such as described below:
1. a buy triangle predicts, most of the time an upwards move
2. a sell triangle predicts, most of the time a downwards move
3. you estimated yourself the stop-loss needed to give enough room for your trades.
4. take profits based on algorithmic support and resistances or your own take profit method.
So what's a good Algorithm Builder configuration? A configuration you're happy with and makes sense.
A better Algorithm Builder setup is one used in demo or a live account w/ small bids for a few weeks, and you're consistent in your trading performance.
If you have any doubt or question, please hit me up directly or ask in the comments section of this script.
I'll never claim I have the best trading methodology or the best indicators. You only will be the judge, and I'll appreciate all the questions and feedback you're sending my way.
They help me a ton to develop indicators based on all the requests I received.
Kind regards,
Dave
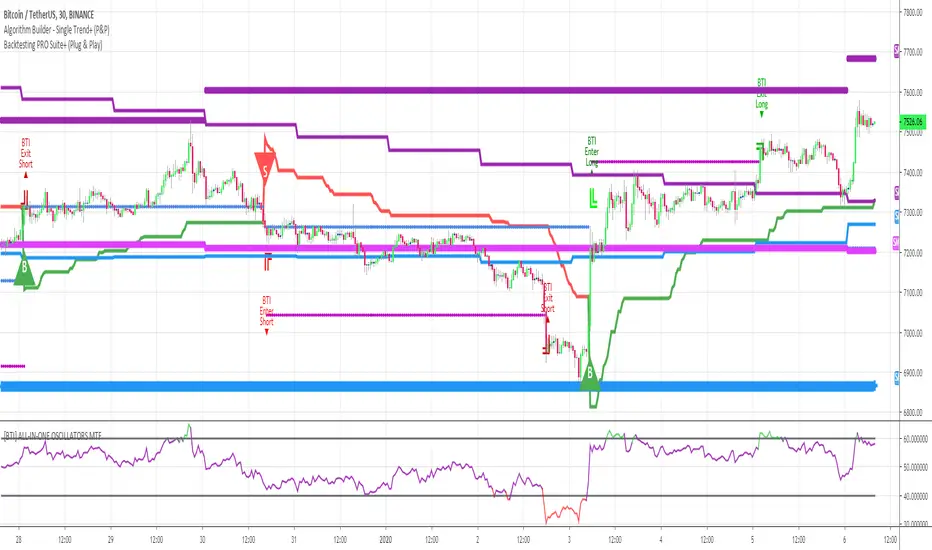
Algorithm Builder - Single Trend+ (MTF)Hello traders
I. SCRIPTS ACCESS AND TRIALS
1. For the trial request access, they have to be done through my website .
2. My website URL is in this script signature at the very bottom (you'll have to scroll down a bit and going past the long description) and in my profile status available here : Daveatt
Due to the new scripts publishing house rules, I won't mention the URL here directly. As I value my partnership with TradingView very much, I prefer showing you the way for finding them :)
3. You may also contact me directly for more information
II. Algorithm Builder - Single Trend+ (MTF)
2.1 Concept
MTF means Multi Timeframes - we all agree that saying MTF is nicer and easier than multi-timeframe.
That script is an upgrade of the Single Trend:
The Algorithm Builder - Single Trend+ (Multiple Timeframes/MTF) is made to detect the convergence of many unrelated indicators, and give a BUY or SELL signal whenever all the selected sub-indicators - each may be using a different timeframe - are converging in the same direction.
Now sit tight because what's going to be announced will be awesome. Are you ready for it?... :)
The MTF version allows to detect the convergence for indicators in different timeframes. Each indicator has its own timeframe - expanding, even more, your trading analysis capabilities.
In other words, you could, for instance, detects the convergence of an H1 MACD with an H2 Supertrend, and why not also adding an m30 Moving Averages cross in the mix.
The Single Trend+ MTF gives one single entry per identified trend - unlike the Multiple Trends editions (also available on my scripts page) which may give more than 1 entry per trend.
The traders select the sub-indicators they want, and see in real-time the BUY and SELL triangles being updated.
2.2 Why the Algorithm Builder Single Trend may help you
I worked with many traders during my career, and their feedback about trading is often pretty similar.
They all tried a lot of complicated indicators, losing their capital, and finally getting back to the basics (even to the basic indicators if I might say)
The art is finding a good combination of indicators and setting strict money/risk management rules.
Easy in concept, but more than 90+% of traders lose money on the markets... which teach us that trading is not only about drawing trendlines, or using cool indicators but finding ways to ease our psychology while trading.
2.3 The Algorithm Builder trading framework
The sub-indicators (full list on our website) weren't chosen randomly. They're based on a trading method we've developed over the last 6 years - while working with traders and other trading quants.
The Algo Builders are made to detect a convergence - and as such, will give a signal once a trend has been identified.
They're not made to detect reversal but have been designed to give a signal when all sub-indicators are either ALL bullish (green) or ALL bearish (red).
We provide a framework based on indicators we selected because they:
1. make sense to be used altogether
2. work on asset classes like INDEX, CRYPTO, STOCK OPTIONS, FOREX, COMMODITIES
3. it may expand your knowledge about what detecting a convergence with pre-selected indicator really means
2.3.1 Supports and Resistances
The indicator displays the main algorithmic supports and resistances according to our trading method.
I think they're relevant for all asset classes, but you're absolutely free to use any different supports/resistances logic if you want to.
I'm not against it because I know that pivots, Fibonacci levels, etc. may work very well also.
2.3.2 Choose your favorite risk management algorithm
1/ Pre-defined Algo S/R method using:
- a supertrend of the stop-loss
- the nearest algorithmic resistances for the take profit levels.
2/ Define your own Stop-loss and Take-profits level in real-time
Stop-Loss Management
For what's following, let's assume that 2 is the stop-loss value you inserted in the indicator, and the Algorithm Builder gives a BUY signal.
This is NOT a recommendation at all, only an example to explain how this feature works.
- %Trailing: The Stop-Loss starts 2% away from the entry price - and will move up (because we're on a BUY trade as per our example) every time your trade will gain 2% profit
- Percentage: The Stop-Loss stays static 2% away from the entry price. There is no trailing here
- TP Trailing: This is a very awesome feature. The stop-loss is set 2% away when the trades start.
When the TP1 is hit, the stop-loss will be moved to the Entry price (also called breakeven).
When the TP2 is hit, the SL is moved to the previous TP1 position
- Fixed: Set the Stop-Loss at a fixed position (value should be in currency/units)
Take Profits Management
You can manage up to 2 take profit levels defined as a percentage or price value.
The expected input is in percentage value (for instance, setting the % target of TP1 to 2% will set the TP1 level 2% away from the entry price
2.3.3 Built-in Trade Manager
This is very likely the most loved utility script that we shared on TradingView.
It's included in your Algorithm Builder - Single Trend+, and will certainly help you immensely to analyze your charts and your trades.
We made sure that all the graphical elements on the chart will be updated in real-time whenever our user change anything on the indicator configuration.
You'll also be able to change the Trade Manager labels positions as you wish :)
2.3.4 Built-in Risk-to-Reward Panel
The good stuff doesn't stop here.
You'll notice that this sometimes green (when in a LONG), sometimes red (when in a SHORT) panel at the right of your chart.
It displays for the selected trading algorithmic (see 2.3.2 above), a ton of useful real-time analytics.
- Entry Price: the price when the Algorithm Builder will give a signal.
- The Trade PnL in percentage.
- Entry Stop Loss: Distance (in currency/units) between the selected stop-loss algorithm (percent, trailing, TP trailing, etc.) and the entry price.
- Entry TP1: Distance (in currency/units) between the entry price and the first take profit
- Entry TP2: Distance (in currency/units) between the entry price and the second take profit
- Risk/Reward TP1: Using the Stop-loss distance at entry, and Take Profit 1 at entry to compute the risk-to-reward ratio.
- Risk/Reward TP2: Using the Stop-loss distance at entry, and Take Profit 2 at entry to compute the risk-to-reward ratio.
For more details, please check the guides section of my website. Links are in my signature and profile status.
2.3.5 Hard Exits
Our trading method is known for the hard exits, also called invalidation.
The Single Trend+ includes a hard exit based on a MACD - settings are flexible and you may update them.
Having a stop-loss protecting your trade is a best practice - Protecting your stop-loss also from getting hit is incredible.
We prefer invalidate a few positions, even if sometimes we don't want to. Rather than the market hard exiting on us, and leaving with our hard-working money.
2.3.6 Alerts
Alerts are enabled for:
- BUY/SELL triangles signals
- Trade Manager (SL, TP1, TP2)
- Hard Exits
III. Pain points that we're trying to solve with our Algorithm Builders
Issue #1 There are many informations / indicators / strategies / backtests / noise. Finding the right ones is not a simple task.
Solution #1 A reliable system that removes the external noise is much needed in trading to stay "in the game".
Issue #2 Trading could be quite stressful - The majority doesn't lose in trading because technical analysis is hard, but because managing our psychology is one of the hardest things a human can do.
Solution #2 Some ways to reduce the "trading stress" could be: getting better quality signals and trading like a "machine". Forgetting about Twitter and trusting the system you designed.
Issue #3 Trading without strict rules and only based on what we feel, or what we think the market should do is the fastest way to kiss our money goodbye.
Only 1 indicator generally is not enough. Traders generally use a combination of several indicators but they're monitoring them individually.
It's normal then to feel exhausted at the end of the day ^^ (to say the least)... and exhaustion leads to mistakes which leads to..... (I'm sure you got it) ... capital loss.
Solution #3 As a trader, I needed a trading framework and a method. I offer our trading method but they're plenty others out there. We cannot claim obviously it's the best ever ....but let's say we're using those exact same
scripts ourselves for our trading. And this what we've been recommending our clients to trade with for the past years. Also, having a tool detecting the convergence of several indicators and giving 1 unique signal
for BUY/SELL position will save you a lot of time/energy, and perhaps might help you out getting better trading performance.
III. Resolving a complex puzzle and having fun in the process
Trading has to stay a passion and not (only be) a source of intense stress.
The most successful traders I know are "trading geeks" - literally always looking for optimizing, searching for the best possible entries, setups, indicators, tools, etc.
For them, it's not even about the money anymore, but only about beating their previous performance.
Why are they doing this? Because it's fun
Might appears as a bold statement, but I guarantee that looking for setups is fun.
One of our users even told us, that it's like playing with "Legos" and we couldn't possibly agree more.
IV. Designing a system that "makes sense"
Another bold statement now. Brace yourselves ladies and gentlemen
The Algorithm Builders allow to design trading systems quickly. What could takes days/weeks/months to find out... might be now within your reach in less than a few hours.
With a bit of practice, less than an hour might be enough per asset/timeframe to find a system that makes sense to you and adapted to your trading capital and psychology.
Assuming our users read our guides and are fully committed to learning a new way of trading - then we do guarantee you'll be able to design kick-ass trading systems that make sense.
"Making sense" doesn't mean at all it's guaranteed to win, it means you're the one defining the convergence of indicators, using your Algorithm Builder, and observe that most of the time - whenever there is a BUY signal, the candlesticks are going upwards - whenever there is a SELL signal, it's going downwards.
This is a necessary step to make real progress from a trading analyst perspective - and hopefully could lead to profits.
V. Algorithm Builder versus the main trader enemy(=psychology)
This indicator has the goal to help solving one of the MAIN issues encountered by traders.
Most of traders realize, they can't perform with only 1 indicator (or 1 price pattern or 1 price action) and need a combination of multiple indicators before getting in a trade.
Far from being a magic pill, if it could at least reduce the stress you have while trading, then we'll consider we made a great job - it's a technical "useless noise remover", and needs to be followed strictly.
Such trust in a trading system can only be built by testing your Algorithm Builder configuration on either:
1. a demo account
2. or a live account with small bids. And then, increasing progressively the bids if your capital increases progressively.
Though, you should still use your common sense. (for instance: if we get a BUY signal right on a big timeframe resistance we're hitting for the first time).
I'm aware this is a new way of trading but for many, and while we cannot foresee the future, neither predict performance, we believe it might save you a lot of time to find good signals.
My maximum level of happiness will be reached the day when our users will contact me and showing me setups being mine.
I'm sure that even I can learn from my users and, we can all learn from each other Algorithm Builder configuration
VI. What is a wrong or bad configuration?
Simply put. If you see that most of your signals react such as described below:
1. a buy triangle predicts, most of the time an upwards move
2. a sell triangle predicts, most of the time a downwards move
3. you estimated yourself the stop-loss needed to give enough room for your trades.
4. take profits based on algorithmic support and resistances or your own take profit method.
So what's a good Algorithm Builder configuration? A configuration you're happy with and makes sense.
A better Algorithm Builder setup is one used in demo or a live account w/ small bids for a few weeks, and you're consistent in your trading performance.
If you have any doubt or question, please hit me up directly or ask in the comments section of this script.
I'll never claim I have the best trading methodology or the best indicators. You only will be the judge, and I'll appreciate all the questions and feedback you're sending my way.
They help me a ton to develop indicators based on all the requests I received.
Kind regards,
Dave

Algorithm Builder - Single Trend+Hello traders
I. SCRIPTS ACCESS AND TRIALS
1. For the trial request access, they have to be done through my website .
2. My website URL is in this script signature at the very bottom (you'll have to scroll down a bit and going past the long description) and in my profile status available here : Daveatt
Due to the new scripts publishing house rules, I won't mention the URL here directly. As I value my partnership with TradingView very much, I prefer showing you the way for finding them :)
3. You may also contact me directly for more information
II. Algorithm Builder - Single Trend+
2.1 Concept
That script is an upgrade of the Single Trend:
The Algorithm Builder - Single Trend+ was made to detect the convergence (also called confluence) of many unrelated indicators, giving a BUY or SELL signal whenever all the selected sub-indicators are converging in the same direction.
The Single Trend gives one single entry per identified trend - unlike the Multiple Trends editions (also available on my scripts page) which may give more than 1 entry per trend.
The traders select the sub-indicators they want, and see in real-time the BUY and SELL triangles being updated.
2.2 Why the Algorithm Builder Single Trend may help you
I worked with many traders during my career, and their feedback about trading is often pretty similar.
They all tried a lot of complicated indicators, losing their capital, and finally getting back to the basics (even to the basic indicators if I might say)
The art is finding a good combination of indicators and setting strict money/risk management rules.
Easy in concept, but more than 90+% of traders lose money on the markets... which teach us that trading is not only about drawing trendlines, or using cool indicators but finding ways to ease our psychology while trading.
2.3 The Algorithm Builder trading framework
The sub-indicators (full list on our website) weren't chosen randomly. They're based on a trading method we've developed over the last 6 years - while working with traders and other trading quants.
The Algo Builders are made to detect a convergence - and as such, will give a signal once a trend has been identified.
They're not made to detect reversal but have been designed to give a signal when all sub-indicators are either ALL bullish (green) or ALL bearish (red).
We provide a framework based on indicators we selected because they:
1. make sense to be used altogether
2. work on asset classes like INDEX, CRYPTO, STOCK OPTIONS, FOREX, COMMODITIES
3. it may expand your knowledge about what detecting a convergence with pre-selected indicator really means
2.3.1 Supports and Resistances
The indicator displays the main algorithmic supports and resistances according to our trading method.
I think they're relevant for all asset classes, but you're absolutely free to use any different supports/resistances logic if you want to.
I'm not against it because I know that pivots, Fibonacci levels, etc. may work very well also.
2.3.2 Choose your favorite risk management algorithm
1/ Pre-defined Algo S/R method using:
- a supertrend of the stop-loss
- the nearest algorithmic resistances for the take profit levels.
2/ Define your own Stop-loss and Take-profits level in real-time
Stop-Loss Management
For what's following, let's assume that 2 is the stop-loss value you inserted in the indicator, and the Algorithm Builder gives a BUY signal.
This is NOT a recommendation at all, only an example to explain how this feature works.
- %Trailing: The Stop-Loss starts 2% away from the entry price - and will move up (because we're on a BUY trade as per our example) every time your trade will gain 2% profit
- Percentage: The Stop-Loss stays static 2% away from the entry price. There is no trailing here
- TP Trailing: This is a very awesome feature. The stop-loss is set 2% away when the trades start.
When the TP1 is hit, the stop-loss will be moved to the Entry price (also called breakeven).
When the TP2 is hit, the SL is moved to the previous TP1 position
- Fixed: Set the Stop-Loss at a fixed position (value should be in currency/units)
Take Profits Management
You can manage up to 2 take profit levels defined as a percentage or price value.
The expected input is in percentage value (for instance, setting the % target of TP1 to 2% will set the TP1 level 2% away from the entry price
2.3.3 Built-in Trade Manager
This is very likely the most loved utility script that we shared on TradingView.
It's included in your Algorithm Builder - Single Trend+, and will certainly help you immensely to analyze your charts and your trades.
We made sure that all the graphical elements on the chart will be updated in real-time whenever our user change anything on the indicator configuration.
You'll also be able to change the Trade Manager labels positions as you wish :)
2.3.5 Built-in Risk-to-Reward Panel
The good stuff doesn't stop here.
You'll notice that this sometimes green (when in a LONG), sometimes red (when in a SHORT) panel at the right of your chart.
It displays for the selected trading algorithmic (see 2.3.2 above), a ton of useful real-time analytics.
- Entry Price: the price when the Algorithm Builder will give a signal.
- The Trade PnL in percentage.
- Entry Stop Loss: Distance (in currency/units) between the selected stop-loss algorithm (percent, trailing, TP trailing, etc.) and the entry price.
- Entry TP1: Distance (in currency/units) between the entry price and the first take profit
- Entry TP2: Distance (in currency/units) between the entry price and the second take profit
- Risk/Reward TP1: Using the Stop-loss distance at entry, and Take Profit 1 at entry to compute the risk-to-reward ratio.
- Risk/Reward TP2: Using the Stop-loss distance at entry, and Take Profit 2 at entry to compute the risk-to-reward ratio.
For more details, please check the guides section of my website. Links are in my signature and profile status.
2.3.6 Hard Exits
Our trading method is known for the hard exits, also called invalidation.
The Single Trend+ includes a hard exit based on a MACD - settings are flexible and you may update them.
Having a stop-loss protecting your trade is a best practice - Protecting your stop-loss also from getting hit is incredible.
We prefer invalidate a few positions, even if sometimes we don't want to. Rather than the market hard exiting on us, and leaving with our hard-working money.
2.3.7 Alerts
Alerts are enabled for:
- BUY/SELL triangles signals
- Trade Manager (SL, TP1, TP2)
- Hard Exits
III. Pain points that we're trying to solve with our Algorithm Builders
Issue #1 There are many informations / indicators / strategies / backtests / noise. Finding the right ones is not a simple task.
Solution #1 A reliable system that removes the external noise is much needed in trading to stay "in the game".
Issue #2 Trading could be quite stressful - The majority doesn't lose in trading because technical analysis is hard, but because managing our psychology is one of the hardest things a human can do.
Solution #2 Some ways to reduce the "trading stress" could be: getting better quality signals and trading like a "machine". Forgetting about Twitter and trusting the system you designed.
Issue #3 Trading without strict rules and only based on what we feel, or what we think the market should do is the fastest way to kiss our money goodbye.
Only 1 indicator generally is not enough. Traders generally use a combination of several indicators but they're monitoring them individually.
It's normal then to feel exhausted at the end of the day ^^ (to say the least)... and exhaustion leads to mistakes which leads to..... (I'm sure you got it) ... capital loss.
Solution #3 As a trader, I needed a trading framework and a method. I offer our trading method but they're plenty others out there. We cannot claim obviously it's the best ever ....but let's say we're using those exact same
scripts ourselves for our trading. And this what we've been recommending our clients to trade with for the past years. Also, having a tool detecting the convergence of several indicators and giving 1 unique signal
for BUY/SELL position will save you a lot of time/energy, and perhaps might help you out getting better trading performance.
IV. Resolving a complex puzzle and having fun in the process
Trading has to stay a passion and not (only be) a source of intense stress.
The most successful traders I know are "trading geeks" - literally always looking for optimizing, searching for the best possible entries, setups, indicators, tools, etc.
For them, it's not even about the money anymore, but only about beating their previous performance.
Why are they doing this? Because it's fun
Might appears as a bold statement, but I guarantee that looking for setups is fun.
One of our users even told us, that it's like playing with "Legos" and we couldn't possibly agree more.
V. Designing a system that "makes sense"
Another bold statement now. Brace yourselves ladies and gentlemen
The Algorithm Builders allow to design trading systems quickly. What could takes days/weeks/months to find out... might be now within your reach in less than a few hours.
With a bit of practice, less than an hour might be enough per asset/timeframe to find a system that makes sense to you and adapted to your trading capital and psychology.
Assuming our users read our guides and are fully committed to learning a new way of trading - then we do guarantee you'll be able to design kick-ass trading systems that make sense.
"Making sense" doesn't mean at all it's guaranteed to win, it means you're the one defining the convergence of indicators, using your Algorithm Builder, and observe that most of the time - whenever there is a BUY signal, the candlesticks are going upwards - whenever there is a SELL signal, it's going downwards.
This is a necessary step to make real progress from a trading analyst perspective - and hopefully could lead to profits.
VI. Algorithm Builder versus the main trader enemy(=psychology)
This indicator has the goal to help solving one of the MAIN issues encountered by traders.
Most of traders realize, they can't perform with only 1 indicator (or 1 price pattern or 1 price action) and need a combination of multiple indicators before getting in a trade.
Far from being a magic pill, if it could at least reduce the stress you have while trading, then we'll consider we made a great job - it's a technical "useless noise remover", and needs to be followed strictly.
Such trust in a trading system can only be built by testing your Algorithm Builder configuration on either:
1. a demo account
2. or a live account with small bids. And then, increasing progressively the bids if your capital increases progressively.
Though, you should still use your common sense. (for instance: if we get a BUY signal right on a big timeframe resistance we're hitting for the first time).
I'm aware this is a new way of trading but for many, and while we cannot foresee the future, neither predict performance, we believe it might save you a lot of time to find good signals.
My maximum level of happiness will be reached the day when our users will contact me and showing me setups being mine.
I'm sure that even I can learn from my users and, we can all learn from each other Algorithm Builder configuration
VII. What is a wrong or bad configuration?
Simply put. If you see that most of your signals react such as described below:
1. a buy triangle predicts, most of the time an upwards move
2. a sell triangle predicts, most of the time a downwards move
3. you estimated yourself the stop-loss needed to give enough room for your trades.
4. take profits based on algorithmic support and resistances or your own take profit method.
So what's a good Algorithm Builder configuration? A configuration you're happy with and makes sense.
A better Algorithm Builder setup is one used in demo or a live account w/ small bids for a few weeks, and you're consistent in your trading performance.
If you have any doubt or question, please hit me up directly or ask in the comments section of this script.
I'll never claim I have the best trading methodology or the best indicators. You only will be the judge, and I'll appreciate all the questions and feedback you're sending my way.
They help me a ton to develop indicators based on all the requests I received.
Kind regards,
Dave
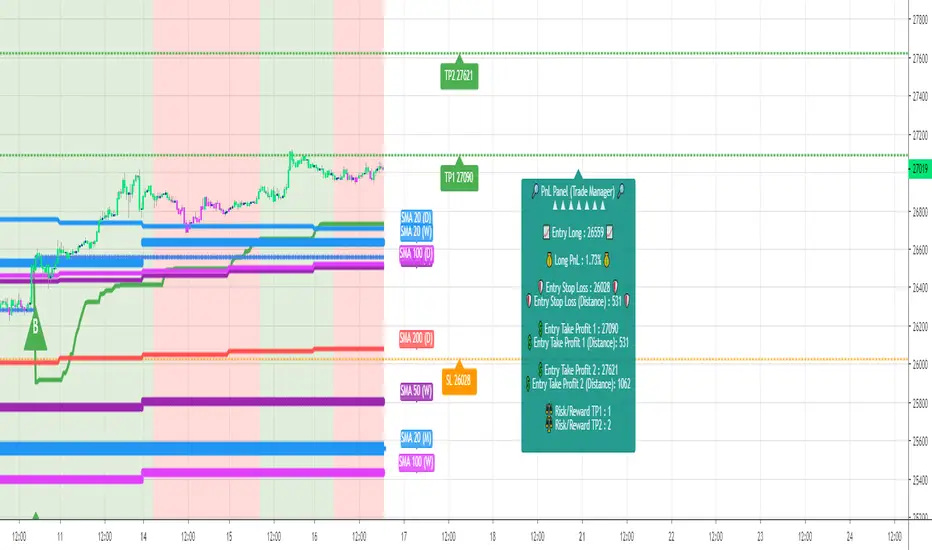
Call-Put Cross Strike Match [Pro]📊 Call-Put Cross Strike Match - Professional Options Trading Indicator
Advanced NSE Options Analysis with AI-Powered Trading Signals & Dynamic Display
🎯 Overview
The Call-Put Cross Strike Match is an institutional-grade options analysis tool designed exclusively for NSE NIFTY and BANKNIFTY traders. Built on Pine Script v6, this indicator combines sophisticated cross-strike matching algorithms with intelligent trading signal generation to identify optimal options trading opportunities in real-time.
What makes it unique:
Analyzes 25 call-put combinations simultaneously
Generates actionable BUY/SELL signals using professional strategies
Fully customizable display with 9 table positions and 6 size options
Simplified setup with semi-automatic ATM detection
Clean, clutter-free interface with only essential information
Perfect for intraday scalpers, premium sellers, and positional options traders.
✨ Key Features
1. 🔍 Advanced Cross-Strike Matching Algorithm
The indicator calculates price differences for all 25 combinations (5 call strikes × 5 put strikes) and identifies the best matches based on put-call parity.
How it works:
Compares each call option price with every put option price
Calculates absolute difference: |Call - Put |
Ranks all 25 combinations from lowest to highest difference
Highlights top 3 or top 5 matches with visual checkmarks
Visual indicators:
✓✓ (Double check) = Best match (lowest price difference)
✓ (Single check) = Good matches (top 3 or top 5)
Empty cells = No match (significant price difference)
Why this matters:
When Call ≈ Put at same strike, it indicates fair pricing and synthetic position opportunities. The indicator automatically finds these opportunities across different strike combinations.
2. 🎯 Intelligent Trading Signals (Last Column)
The indicator generates professional trading recommendations based on Call-Put price difference analysis:
Signal Types:
BUY CE - Long call opportunity (bullish)
SELL CE - Short call opportunity (premium selling)
BUY PE - Long put opportunity (bearish/hedge)
SELL PE - Short put opportunity (premium selling)
BULL - Moderate bullish bias
BEAR - Moderate bearish bias
ATM - Neutral market (near parity)
NEUTRAL - No clear bias
Color-Coded for Quick Decisions:
🟩 Green = Long opportunities (BUY CE, BULL)
🟥 Red = Short call opportunities (SELL CE)
🟧 Orange = Long put opportunities (BUY PE)
🟫 Maroon = Short put opportunities (SELL PE)
⬛ Gray = Neutral zones (ATM, NEUTRAL)
3. 🤖 Three Professional Signal Modes
SMART Mode (Recommended) 🎯
Context-aware institutional strategy that considers strike position relative to spot price.
Signal Logic:
text
OTM Call Expensive (C-P > threshold, Strike > Spot):
→ SELL CE (Premium selling opportunity)
ITM Call Underpriced (C-P > threshold, Strike < Spot):
→ BUY CE (Synthetic long opportunity)
OTM Put Expensive (C-P < -threshold, Strike < Spot):
→ SELL PE (Premium selling opportunity)
ITM Put Underpriced (C-P < -threshold, Strike > Spot):
→ BUY PE (Protection or synthetic short)
Near Parity (|C-P| < threshold/4):
→ ATM (Neutral market, straddle/strangle zone)
Moderate Imbalance:
→ BULL or BEAR (Directional bias without extreme pricing)
Best for: Professional traders, option writers, synthetic position builders
MOMENTUM Mode 📈
Trend-following strategy that rides market momentum.
Signal Logic:
text
Calls Expensive (C-P > threshold):
→ BUY CE (Follow bullish momentum)
Puts Expensive (C-P < -threshold):
→ BUY PE (Follow bearish momentum)
Near Parity:
→ NEUTRAL (No clear trend)
Best for: Intraday scalpers, directional traders, swing traders
MEAN REVERSION Mode 🔄
Counter-trend strategy focused on premium selling.
Signal Logic:
text
Calls Overpriced (C-P > threshold):
→ SELL CE (Collect inflated premium)
Puts Overpriced (C-P < -threshold):
→ SELL PE (Collect inflated premium)
Near Parity:
→ ATM (Fair value, no edge)
Best for: Option writers, theta decay strategies, credit spread traders
4. 🎨 Fully Customizable Display
Dynamic Table Positioning (9 Options):
Top: left, center, right
Middle: left, center, right
Bottom: left, center, right
Choose position based on your chart layout and other indicators.
Dynamic Table Sizing (6 Options):
Auto - Adapts to content
Tiny - Minimal space (for cluttered charts)
Small - Default, best balance
Normal - Medium size (1080p monitors)
Large - Big text (4K monitors)
Huge - Maximum size (presentations)
Text scales intelligently:
Headers, data, and checkmarks adjust proportionally
Checkmarks remain visible even in tiny mode
Info row stays readable at all sizes
5. ⚙️ Simplified Input System
Auto Mode (Recommended):
Enter just 5 strikes once at market open - used for both calls and puts.
Example for NIFTY at 25,900:
text
Strike 1: 25850 (ATM - 100)
Strike 2: 25900 (ATM - 50)
Strike 3: 25950 (ATM)
Strike 4: 26000 (ATM + 50)
Strike 5: 26050 (ATM + 100)
Manual Mode (Advanced):
Enter separate call and put strikes for cross-strike arbitrage analysis.
Why this matters:
50% fewer inputs compared to traditional indicators
One-time setup at market open
Rarely needs updating (only if market moves 100+ points)
6. 🎛️ Semi-Automatic ATM Detection
The indicator automatically:
Detects current NIFTY/BANKNIFTY spot price
Calculates ATM strike (rounded to nearest 50 or 100)
Marks ATM strikes with *ATM in the table
Displays ATM and spot price in info box
No manual recalculation needed!
7. 📊 Clean Information Display
Main Table (Top/Middle/Bottom):
CE \ PE matrix showing all strike combinations
Checkmarks (✓✓ and ✓) highlighting best matches
SIGNAL column with color-coded trading recommendations
Best Match footer showing optimal combination
Info row displaying symbol, signal mode, and spot price
Info Box (Bottom Left):
Symbol (NIFTY/BANKNIFTY)
Signal Mode (Smart/Momentum/Mean Reversion)
Current Spot Price
Detected ATM Strike
Best Matched Call Strike
Best Matched Put Strike
Match Difference
C-P value for best match
📋 Quick Setup Guide (3 Steps)
Step 1: Add Indicator
Open NIFTY or BANKNIFTY chart on TradingView
Add "Call-Put Cross Strike Match " from indicators
Step 2: Configure Basic Settings
text
Symbol Detection: Auto (reads from chart)
Expiry Date: 251219 (format: YYMMDD for 19-Dec-2025)
Strike Mode: Auto
Strike Interval: 50 (for NIFTY) or 100 (for BANKNIFTY)
Step 3: Enter Strikes
At market open (9:15 AM), check current price and enter 5 strikes:
text
Example: NIFTY at 25,937
Strike 1: 25850 (ATM - 100)
Strike 2: 25900 (ATM - 50)
Strike 3: 25950 (ATM) ← Rounded to nearest 50
Strike 4: 26000 (ATM + 50)
Strike 5: 26050 (ATM + 100)
That's it! The indicator handles everything else automatically.
💡 Real-World Use Cases
1. 📉 Premium Selling (Mean Reversion Mode)
Scenario: Looking for overpriced options to write
How to use:
Set Signal Mode to "Mean Reversion"
Set Threshold: 30 (NIFTY) or 75 (BANKNIFTY)
Look for SELL CE or SELL PE signals with ✓ or ✓✓
Sell naked options or credit spreads at those strikes
Target 30-50% profit or 3-5 days theta decay
Perfect for: Credit spreads, iron condors, covered calls, naked puts
2. 📈 Directional Trading (Momentum Mode)
Scenario: Scalping intraday moves
How to use:
Set Signal Mode to "Momentum"
Set Threshold: 15 (aggressive) or 25 (conservative)
BUY CE signal + ✓✓ = Long call entry
Enter with tight stop (20% of premium)
Target 30-50% gain within 1-2 hours
Perfect for: Intraday scalping, swing trading, trend following
3. 🔄 Synthetic Positions (Smart Mode)
Scenario: Building synthetic long/short with defined risk
How to use:
Set Signal Mode to "Smart"
Look for BUY CE at ITM strike + SELL PE at OTM strike
Both should have ✓ indicator (good parity)
Creates synthetic long position
Lower capital than buying futures
Perfect for: Professional traders, arbitrage, capital efficiency
4. ⚖️ ATM Strategy Optimization (Smart Mode)
Scenario: Finding optimal strikes for straddle/strangle
How to use:
Identify strike marked *ATM
Check if signal shows ATM (balanced market)
If BULL/BEAR → Market has directional bias, adjust accordingly
✓✓ indicates best matched strike for neutral strategies
Perfect for: Volatility trading, earnings plays, event trading
5. 🛡️ Hedging Optimization (Smart Mode)
Scenario: Protecting long equity positions
How to use:
Look for BUY PE signals (protection signals)
Avoid strikes with SELL PE (expensive hedges)
✓✓ shows best value for hedge entry
Optimize hedge timing and strike selection
Perfect for: Portfolio hedging, risk management, protective puts
⚙️ Settings Guide
Symbol Settings
Symbol Detection: Auto (recommended) or Manual
Manual Symbol: NIFTY or BANKNIFTY
Expiry Date: Format YYMMDD (e.g., 251219 = 19-Dec-2025)
Update every Thursday after 3:30 PM for next week's expiry
Strike Settings
Strike Mode: Auto (recommended) or Manual
Strike Interval:
50 for NIFTY
100 for BANKNIFTY
Trading Signals
Signal Mode: Smart / Momentum / Mean Reversion
Smart: Professional institutional strategy (default)
Momentum: Trend-following for scalpers
Mean Reversion: Premium selling for writers
Signal Threshold: Sensitivity in points
NIFTY Recommendations:
Conservative: 30-40 points (fewer, higher quality signals)
Balanced: 20-25 points (default)
Aggressive: 10-15 points (more signals, more noise)
BANKNIFTY Recommendations:
Conservative: 75-100 points
Balanced: 50-60 points (default)
Aggressive: 30-40 points
Algorithm Settings
Matching Mode:
Top 3: Shows 3 best matches (cleaner display)
Top 5: Shows 5 best matches (more opportunities)
Display Settings
Show Matching Table: Enable/disable main table
Table Position: Choose from 9 positions
top_right (default) - Doesn't block price action
middle_right - Centered vertical view
bottom_right - If top is crowded
Table Size: Choose from 6 sizes
small (default) - Best for most users
normal - For 1080p/4K monitors
tiny - If you have many indicators
📊 Understanding The Table
Table Layout Example:
text
CE \ PE | 25950 | 25900 | 25850 | 26000 | 26050 | SIGNAL
---------|-------|-------|-------|-------|-------|--------
25850 | | | | | | SELL PE
25900*ATM| | ✓ | | | | ATM
25950 | ✓✓ | | | | | BULL
26000 | | | | ✓ | | BUY CE
26050 | | | | | | SELL CE
---------|-------|-------|-------|-------|-------|--------
Best Match: 25950 / 25950 (0.25)
Info: NIFTY | Smart | Spot:25881.9
Reading the Table:
Rows (Left): Call option strike prices
Columns (Top): Put option strike prices
Cells: Checkmarks where Call ≈ Put
✓✓: Best match (minimum price difference)
✓: Good matches (top 3 or 5)
Empty: Prices too different (no match)
*ATM: Automatically detected at-the-money strike
SIGNAL Column: Actionable trading recommendation for each call strike
Info Box Metrics:
Symbol: Currently analyzed index
Signal Mode: Active strategy
Spot: Current underlying price
ATM: Calculated at-the-money strike
Best Call: Matched call strike
Best Put: Matched put strike
Match Diff: Price difference (lower = better)
C-P (Best): Call minus Put for best match
📈 Best Practices
Strike Selection & Maintenance
At Market Open (9:15 AM):
Check current price (e.g., NIFTY at 25,937)
Round to nearest interval (25,950 for 50 interval)
Enter 5 strikes: -100, -50, 0, +50, +100 from ATM
Update Frequency:
Usually no update needed entire day
Update only if market moves 100+ points from initial ATM
Typically 0-2 updates per trading session
Signal Interpretation by Confidence Level
High Confidence (✓✓ + Signal):
Best match indicator present
Strongest signal quality
Highest probability setup
Medium Confidence (✓ + Signal):
Good match present
Reliable signal
Acceptable risk/reward
Low Confidence (Signal without ✓):
No match indicator
Strike far from parity
Requires additional confirmation
Risk Management Rules
Never trade signals blindly. Always:
✅ Confirm with price action and support/resistance
✅ Check overall market trend (NIFTY/BANKNIFTY direction)
✅ Consider time decay (theta) for your position
✅ Monitor IV changes (implied volatility)
✅ Use proper position sizing (1-2% risk per trade)
✅ Set stop losses (20-30% of premium for longs)
✅ Have profit targets (30-50% for scalps)
Timeframe Selection
Intraday Trading:
Use 5-minute or 15-minute chart
Momentum or Smart mode
Lower threshold (aggressive)
Quick entries and exits
Positional Trading:
Use hourly or daily chart
Smart or Mean Reversion mode
Higher threshold (conservative)
Swing trade positions
Combining with Other Tools
Recommended complements:
Support/resistance levels (horizontal lines)
Trend indicators (EMA 20/50, SuperTrend)
Volume analysis (confirm breakouts)
India VIX (volatility context)
Option chain data (open interest)
🎓 Strategy Examples
Strategy 1: Professional Premium Selling
text
Mode: Mean Reversion
Threshold: 30 (NIFTY) / 75 (BANKNIFTY)
Timeframe: Daily
Rules:
1. Wait for SELL CE or SELL PE signal
2. Verify strike has ✓ or ✓✓ (good parity)
3. Check if OTM (Strike away from spot)
4. Sell option or create credit spread
5. Target: 30-50% profit or 3-5 days theta
6. Stop: If signal changes to BUY
Position: Naked short or credit spreads
Risk: Define with spreads or capital allocation
Strategy 2: Intraday Momentum Scalping
text
Mode: Momentum
Threshold: 15 (aggressive)
Timeframe: 5-minute
Rules:
1. Wait for BUY CE signal + ✓✓
2. Enter long call immediately
3. Stop loss: 20% of premium paid
4. Target 1: 30% gain (partial exit)
5. Target 2: 50% gain (full exit)
6. Exit if signal changes or 2 hours pass
Position: Long calls or long puts only
Risk: 1-2% of capital per trade
Strategy 3: Synthetic Long Position
text
Mode: Smart
Threshold: 25 (NIFTY) / 60 (BANKNIFTY)
Timeframe: Hourly
Rules:
1. Identify BUY CE signal at ITM strike
2. Identify SELL PE signal at OTM strike
3. Both should have ✓ indicator
4. Buy ITM call + Sell OTM put = Synthetic Long
5. Lower capital than futures
6. Defined risk (width of strikes)
Position: Call debit + Put credit
Risk: Net debit paid (defined risk)
Strategy 4: ATM Straddle Entry
text
Mode: Smart
Threshold: 20 (default)
Timeframe: Daily
Rules:
1. Find strike marked *ATM
2. Check signal shows "ATM" (neutral)
3. Verify ✓✓ at that strike
4. Sell ATM call + Sell ATM put
5. Collect maximum premium
6. Exit at 30% profit or before expiry
Position: Short straddle or iron condor
Risk: Use defined risk (iron condor recommended)
🔔 Important Notes
Data Accuracy
Indicator uses TradingView's NSE options data feed
Always verify prices independently before trading
Ensure market is open (9:15 AM - 3:30 PM IST)
Check for "-" in cells indicating missing data
Expiry Management
Update expiry date every week on Thursday post-closing
Format: YYMMDD (6 digits)
Weekly expiry: Every Thursday
Monthly expiry: Last Thursday of month
Strike Format
NIFTY: Multiples of 50 (25850, 25900, 25950...)
BANKNIFTY: Multiples of 100 (51800, 51900, 52000...)
Wrong strikes = No data in table
Performance Optimization
Indicator updates every bar close
No lag or performance issues
Works on all timeframes (1m to 1D)
Maximum 5 calls + 5 puts = 10 security calls (within limits)
⚠️ Disclaimer
Trading options involves substantial risk of loss and is not suitable for all investors. This indicator is provided for educational and informational purposes only. It does not constitute financial advice, investment advice, or trading advice.
Important disclaimers:
Options can expire worthless, resulting in 100% loss
Past performance of signals is not indicative of future results
Accuracy depends on TradingView's NSE data feed
Signals are mathematical analysis, not predictions
You are solely responsible for your trading decisions
The developer is not liable for any trading losses incurred while using this indicator.
Before trading, ensure you understand:
Options Greeks (Delta, Gamma, Theta, Vega, Rho)
Implied volatility and its impact
Time decay and expiration risks
Assignment risk for short positions
Liquidity and slippage considerations
Margin requirements and capital needs
Always:
Use proper risk management (1-2% per trade)
Trade with capital you can afford to lose
Paper trade before live trading
Consult with a licensed financial advisor
Start with small position sizes
Never risk more than you can afford to lose
📊 Technical Specifications
Platform: TradingView Pine Script v6
Exchanges: NSE (National Stock Exchange of India)
Instruments: NIFTY, BANKNIFTY options
Timeframes: All (1m, 5m, 15m, 1h, 1D)
Strikes Analyzed: 5 calls × 5 puts = 25 combinations
Security Calls: 10 (5 calls + 5 puts)
Table Positions: 9 (all corners and centers)
Table Sizes: 6 (auto to huge)
Signal Modes: 3 (Smart, Momentum, Mean Reversion)
Performance: Optimized, minimal lag
🎯 Who Should Use This?
✅ Perfect For:
Options Traders: Intraday and positional
Premium Sellers: Option writers and theta strategists
Arbitrage Traders: Synthetic position builders
Straddle/Strangle Traders: ATM strategy traders
Professional Traders: Institutional-grade analysis
Volatility Traders: IV imbalance exploiters
Scalpers: Quick intraday moves
❌ Not Suitable For:
Stock options traders (NSE index-specific)
Equity-only traders (requires options knowledge)
International markets (NSE format only)
Complete beginners (requires basic options understanding)
💬 FAQ
Q: Why manual strike entry? Why not fully automatic?
A: Pine Script's type system limits fully automatic strike generation from live data. However, setup takes just 30 seconds once at market open, and the indicator handles all analysis automatically throughout the day.
Q: How often should I update strikes?
A: Rarely! Only when market moves 100+ points from initial ATM. Usually 0-2 times per day, even in volatile markets.
Q: Which Signal Mode is best?
A: Smart mode (default) for professional trading. Use Momentum for intraday scalping, Mean Reversion for premium selling.
Q: Can I use this for stock options?
A: No. The indicator is designed specifically for NSE index options (NIFTY and BANKNIFTY) with NSE format.
Q: Does it work on mobile?
A: Yes, but table display is optimized for desktop/tablet screens. Use "tiny" or "small" size on mobile.
Q: What if I see "-" in cells?
A: Check expiry format (YYMMDD), verify strikes match NSE strikes, and ensure market is open.
Q: What's the difference between ✓✓ and ✓?
A: ✓✓ = Best match (lowest price difference), highest quality. ✓ = Good matches (top 3-5), reliable quality.
Q: Can I backtest this indicator?
A: The indicator shows live analysis. For backtesting options strategies, you'll need historical options data and separate backtesting tools.
Q: What does the info box show?
A: Bottom-left box shows key metrics: symbol, signal mode, spot price, ATM strike, best matched strikes, match difference, and C-P value.
Q: Why no chart plotting?
A: v1.0 focuses on clean table display with maximum information density. Chart plotting may be added in future versions based on user feedback.
🙏 Credits
Developed by a professional options trader for the Indian trading community. Inspired by institutional trading desks and market makers who use call-put parity for daily trading decisions.
Found This Helpful?
⭐ Rate 5 stars if it improved your trading
💬 Comment with your strategy results
🔔 Follow for updates and new indicators
📢 Share with fellow options traders
Feature Requests
Continuous improvement based on trader feedback. Suggest features in comments!
Planned Features (v2.0):
Multi-expiry comparison
Greeks display (Delta, Theta, Vega)
Historical signal performance stats
Custom signal formulas
Export to CSV functionality
🏷️ Tags for Search
#Options #OptionsTrading #NIFTY #BANKNIFTY #NSE #India #OptionChain #CallPut #PutCallParity #Straddle #Strangle #ATM #TradingSignals #OptionsStrategy #PremiumSelling #OptionsScanner #Derivatives #IntradayTrading #VolatilityTrading #Arbitrage #SyntheticPosition #OptionsGreeks #OptionsSelling #OptionsWriting #IndianStockMarket #NSEOptions #OptionsAnalysis #TechnicalAnalysis #AlgoTrading #QuantTrading #ProfessionalTrading #TradingIndicator #PineScript #TradingView
📝 Version History
v1.0 (Current - Dec 2025)
Pine Script v6 implementation
Cross-strike matching (5×5 matrix, 25 combinations)
Three signal modes (Smart, Momentum, Mean Reversion)
Trading signal generation with color coding
Dynamic table positioning (9 positions)
Dynamic table sizing (6 sizes)
Intelligent text scaling
Semi-automatic ATM detection
Auto symbol detection
Simplified input system (50% fewer inputs in Auto mode)
Clean information display
Info box with key metrics
NSE NIFTY & BANKNIFTY support
Start trading smarter with institutional-grade options analysis! 📈💰🚀
Disclaimer: Options trading is subject to market risk. Please read all scheme-related documents carefully before investing.

NeuraAlgo - Market DynamicsNeuraAlgo – Market Dynamics
Simplyfying the Market Dynamics
Unlock the complexity of financial markets with NeuraAlgo – Market Dynamics. Designed for traders and investors alike, this intelligent tool distills the chaos of price movements, volume fluctuations, and trend directions into clear, actionable insights. With advanced algorithms working behind the scenes, it simplifies market dynamics so you can focus on making informed decisions, spotting opportunities, and managing risk with confidence.
Behind this simple overlay lies a powerful, complex algorithm.
Main Settings -Main Algorithm
Timeframe – Choose the chart timeframe that the indicator will analyze. It adapts the calculations to the selected interval for precise market insights.
Preset – Select the operating mode:
Main Trend: Focuses on the dominant market trend.
Multi Trend: Analyzes multiple trend layers for a broader perspective.
Sensitivity – Adjusts the indicator’s responsiveness to price changes. Higher values make the system more reactive to market fluctuations, while lower values smooth out minor noise.
Smooth Tuner – Controls the smoothing of the underlying calculations, helping to reduce false signals and provide cleaner trend visualization.
Orderflow Statistics – Toggle to display detailed order flow statistics directly on the chart for deeper market analysis.
Performance Statistics – Toggle to enable backtesting tables, showing historical performance metrics of the indicator for strategy evaluation.
2.Art Settings -Change Visuals
Color Scheme – Select a pre-defined visual theme for your charts:
Bright Light – High-contrast, vibrant colors for maximum clarity.
Freezer Mode – Cool-toned palette for calm, visually comfortable analysis.
Standard Mode – Balanced, neutral colors for everyday use.
Delta Mode – Highlights key differences and movements with distinct colors.
Custom – Fully customize the colors of bullish, bearish, and range elements.
Green / Red / Range (Custom Colors) – When “Custom” is selected, these options allow you to define the colors for bullish (Green), bearish (Red), and neutral/range areas (Range) according to your preference.
Candle Coloring Type – Choose how candles are highlighted based on market signals:
Confirmation Simple – Basic signal-based coloring for clear, direct visualization.
Confirmation Gradient – Smooth gradient-based coloring for more dynamic and aesthetic signal representation.
3.Dashboard -Market Statistics
The Dashboard provides a compact, at-a-glance overview of key market conditions and indicator metrics, helping traders make faster and more informed decisions.
Functionality & Layout – The dashboard dynamically displays multiple sections:
Optimal Scale ⚖️ – Shows key market scaling metrics like volatility for better decision-making.
Risk Manager 📊 – Indicates the active risk management strategy (e.g., Risk-Reward, Partial Exits, or Trailing Stop Loss).
Orderflow Statistics 📈 – Displays market sentiment, footprint strength, and delta trends for precise order flow analysis.
Market Status 🌐 – Highlights current trend conditions and trend strength across different timeframes.
Bias Scores 🎯 – Provides trend strength percentages across multiple timeframes (5min, 15min, 30min, 1H, 4H, 1D) to quickly gauge market bias.
Backtest Performance -A summary panel showing the overall performance of the strategy.
Deposit -The starting capital used for backtesting.
Win Trades -Total number of profitable trades.
Winrate -Percentage of winning trades out of all trades.
Max DD -Maximum drawdown — the largest peak-to-trough loss.
PnL -Net profit or loss generated by the strategy.
Return -Percentage growth of the account during the test.
Profit Factor -Ratio of total profits to total losses.
The dashboard uses color-coded indicators (green for bullish, red for bearish, yellow for neutral) and merged cells for a clean and organized display.
It’s designed to simplify complex market dynamics into a visually intuitive interface, giving traders real-time insights without cluttering the chart.
4.Neura Engineering – Enhancements
This section provides advanced filtering options to fine-tune market analysis, reduce noise, and highlight meaningful trends.
Noise Filter – Smoothens minor price fluctuations to reduce false signals.Noise Sensitivity helps Adjust how aggressively the filter suppresses noise.
Gap Filter – Detects and smooths price gaps to improve trend clarity.Gap Sensitivity helps Controls the responsiveness of the gap filter.
Range Filter – Filters out small-range price movements to focus on significant market swings.helps Adjusts how tightly the filter defines meaningful ranges.
Volatility Filter – Highlights periods of high market volatility while filtering less active periods.helps Sets the threshold for what constitutes high volatility.
Trend Filter – Focuses analysis on strong trends by filtering out weaker signals.helps Determines the minimum strength required for a trend to be considered valid.helps Uses Average True Range to dynamically adjust trend filtering based on market movement.
These enhancement tools allow traders to customize signal clarity, reduce noise, and focus on meaningful market dynamics, creating a cleaner and more actionable charting experience.
5.Neura Overlays – Market Visual Enhancements
These overlays add visual intelligence to your chart, helping you instantly understand trend behavior, sentiment shifts, and price structure.
Reversal Cloud - Highlights potential reversal zones where price may change direction.Reversal Sensitivity helps Controls how quickly the cloud reacts to shifts in momentum.
Sentiment Cloud -Maps the underlying market mood—bullish, bearish, or neutral—directly onto the chart.Sentiment Sensitivity helps Adjusts how sensitive the sentiment readings are.
Price Steps -Draws structured “price steps” that reveal hidden market rhythm, impulse strength, and trend flow.Price Step Depth helps Determines the size and spacing of these steps.
Market Bias -Shows directional bias based on deeper trend pressure and underlying orderflow.Bias Sensitivity helps Controls how strict or lenient the bias detection is.
6.Risk Management Settings – Intelligent Trade Control
This module controls how your trades manage themselves after entry. Choose between traditional Risk/Reward exits, partial profit-taking, or an adaptive trailing stop system.
RiskReward
A classic risk-to-reward exit system.You set a risk multiple (e.g., 1:2), and the indicator automatically sets one Stop Loss and one Take Profit based on that ratio.
Partials
Scales out your position at multiple take-profit levels.Instead of closing the entire trade at once, the system secures profits gradually at TP1, TP2, and TP3 while keeping the remainder running.
TrailingStop
Uses a dynamic stop loss that follows price as it moves in your favor.There is no fixed Take Profit; instead, the trailing stop locks in profit and exits the trade automatically when momentum reverses.
7.Automatic Alert System
This is the System that organizes all settings related to the automatic webhook alert creator inside the indicator.
Rule No. 1 is never lose money. Rule No. 2 is never forget Rule No. 1.
Warren Buffet
NeuraAlgo – Market Dynamics transforms complex market behavior into clear, actionable insights for smarter trading decisions.

Breakout Finder By Hitesh Somani(Aapkainvestments)Breakout Finder By Hitesh Somani(Aapkainvestments)
Welcome to one of the most powerful momentum reversal indicators designed specifically for traders looking to catch high-probability reversal signals with precision and confidence.
✅ This indicator gives high-probability SELL signals based on RSI momentum and Bollinger Band breakouts.
✅ It filters noise and avoids over-trading, focusing only on setups that meet high-conviction criteria with built-in back-to-back signal prevention.
✅ Works best on 5-minute and 15-minute timeframes in trending markets.
✅ Features dual-mode operation: RSI Confirmation mode for momentum validation or Pure Price Action mode for breakout detection.
✅ Automatically calculates Entry, Stop Loss, and Target levels with customizable Risk:Reward ratio (default 1:1.5).
Suggested Rules to Use This Indicator Effectively
Follow these rules and you'll see the accuracy improve significantly:
• Best trading hours: 9:30 AM to 2:30 PM – Avoid trades in the last hour of market
• Entry Strategy: Enter short when the low of the signal candle breaks on the next candle
• Stop Loss: Automatically set at the higher of signal candle high or previous candle high
• Target: Default 1:1.5 Risk:Reward ratio (customizable up to 1:10)
• Trail Stop Loss: After reaching 1:1 risk:reward, consider trailing your stop to lock in profits
• If a new signal comes while an earlier trade is running, the indicator automatically prevents back-to-back signals (shows blue circle for filtered signals)
• Use RSI Confirmation mode for higher accuracy in trending markets, or disable it for pure price action setups
• Monitor the Intelligence Dashboard for real-time RSI, Breakout status, Entry, SL, and Target levels
These simple rules, when followed with discipline, can help you extract consistent profits from momentum reversals and breakout pullback trades.
This isn't just another Indicator — it's built in-house by Hitesh Somani, tested on real price action, and trusted by the Aapka Investment community.
Disclaimer:
This content is purely for educational purposes.
We are not responsible for any financial profits or losses resulting from use of this tool or content.

Risk & Position DashboardRisk & Position Dashboard
Overview
The Risk & Position Dashboard is a comprehensive trading tool designed to help traders calculate optimal position sizes, manage risk, and visualize potential profit/loss scenarios before entering trades. This indicator provides real-time calculations for position sizing based on account size, risk percentage, and stop-loss levels, while displaying multiple take-profit targets with customizable risk-reward ratios.
Key Features
Position Sizing & Risk Management:
Automatic position size calculation based on account size and risk percentage
Support for leveraged trading with maximum leverage limits
Fractional shares support for brokers that allow partial share trading
Real-time fee calculation including entry, stop-loss, and take-profit fees
Break-even price calculation including trading fees
Multi-Target Profit Management:
Support for up to 3 take-profit levels with individual portion allocations
Customizable risk-reward ratios for each take-profit target
Visual profit/loss zones displayed as colored boxes on the chart
Individual profit calculations for each take-profit level
Visual Dashboard:
Clean, customizable table display showing all key metrics
Configurable label positioning and styling options
Real-time tracking of whether stop-loss or take-profit levels have been reached
Color-coded visual zones for easy identification of risk and reward areas
Advanced Configuration:
Comprehensive input validation and error handling
Support for different chart timeframes and symbols
Customizable colors, fonts, and display options
Hide/show individual data fields for personalized dashboard views
How to Use
Set Account Parameters: Configure your account size, maximum risk percentage per trade, and trading fees in the "Account Settings" section.
Define Trade Setup: Use the "Entry" time picker to select your entry point on the chart, then input your entry price and stop-loss level.
Configure Take Profits: Set your desired risk-reward ratios and portion allocations for each take-profit level. The script supports 1-3 take-profit targets.
Analyze Results: The dashboard will automatically calculate and display position size, number of shares, potential profits/losses, fees, and break-even levels.
Visual Confirmation: Colored boxes on the chart show profit zones (green) and loss zones (red), with lines extending to current price levels.
Reset Entry and SL:
You can easily reset the entry and stop-loss by clicking the "Reset points..." button from the script's "More" menu.
This is useful if you want to quickly clear your current trade setup and start fresh without manually adjusting the points on the chart.
Calculations
The script performs sophisticated calculations including:
Position size based on risk amount and price difference between entry and stop-loss
Leverage requirements and position amount calculations
Fee-adjusted risk-reward ratios for realistic profit expectations
Break-even price including all trading costs
Individual profit calculations for partial position closures
Detailed Take-Profit Calculation Formula:
The take-profit prices are calculated using the following mathematical formula:
// Core variables:
// risk_amount = account_size * (risk_percentage / 100)
// total_risk_per_share = |entry_price - sl_price| + (entry_price * fee%) + (sl_price * fee%)
// shares = risk_amount / total_risk_per_share
// direction_factor = 1 for long positions, -1 for short positions
// Take-profit calculation:
net_win = total_risk_per_share * shares * RR_ratio
tp_price = (net_win + (direction_factor * entry_price * shares) + (entry_price * fee% * shares)) / (direction_factor * shares - fee% * shares)
Step-by-step example for a long position (based on screenshot):
Account Size: 2,000 USDT, Risk: 2% = 40 USDT
Entry: 102,062.9 USDT, Stop Loss: 102,178.4 USDT, Fee: 0.06%
Risk per share: |102,062.9 - 102,178.4| + (102,062.9 × 0.0006) + (102,178.4 × 0.0006) = 115.5 + 61.24 + 61.31 = 238.05 USDT
Shares: 40 ÷ 238.05 = 0.168 shares (rounded to 0.17 in display)
Position Size: 0.17 × 102,062.9 = 17,350.69 USDT
Position Amount (with 9x leverage): 17,350.69 ÷ 9 = 1,927.85 USDT
For 2:1 RR: Net win = 238.05 × 0.17 × 2 = 80.94 USDT
TP1 price = (80.94 + (1 × 102,062.9 × 0.17) + (102,062.9 × 0.0006 × 0.17)) ÷ (1 × 0.17 - 0.0006 × 0.17) = 101,464.7 USDT
For 3:1 RR: TP2 price = 101,226.7 USDT (following same formula with RR=3)
This ensures that after accounting for all fees, the actual risk-reward ratio matches the specified target ratio.
Risk Management Features
Maximum Trade Amount: Optional setting to limit position size regardless of account size
Leverage Limits: Built-in maximum leverage protection
Fee Integration: All calculations include realistic trading fees for accurate expectations
Validation: Automatic checking that take-profit portions sum to 100%
Historical Tracking: Visual indication when stop-loss or take-profit levels are reached (within last 5000 bars)
Understanding Max Trade Amount - Multiple Simultaneous Trades:
The "Max Trade Amount" feature is designed for traders who want to open multiple positions simultaneously while maintaining proper risk management. Here's how it works:
Key Concept:
- Risk percentage (2%) always applies to your full Account Size
- Max Trade Amount limits the capital allocated per individual trade
- This allows multiple trades with full risk on each trade
Example from Screenshot:
Account Size: 2,000 USDT
Max Trade Amount: 500 USDT
Risk per Trade: 2% × 2,000 = 40 USDT per trade
Stop Loss Distance: 0.11% from entry
Result: Position Size = 17,350.69 USDT with 35x leverage
Total Risk (including fees): 40.46 USDT
Multiple Trades Strategy:
With this setup, you can open:
Trade 1: 40 USDT risk, 495.73 USDT position amount (35x leverage)
Trade 2: 40 USDT risk, 495.73 USDT position amount (35x leverage)
Trade 3: 40 USDT risk, 495.73 USDT position amount (35x leverage)
Trade 4: 40 USDT risk, 495.73 USDT position amount (35x leverage)
Total Portfolio Exposure:
- 4 simultaneous trades = 4 × 495.73 = 1,982.92 USDT position amount
- Total risk exposure = 4 × 40 = 160 USDT (8% of account)

NSE Pairs Screener-20 pair This advanced Pine Script screener is designed for pairs trading on the National Stock Exchange (NSE) of India. It simultaneously monitors up to 20 stock pairs, calculates key statistical metrics, and provides real-time trading signals based on mean reversion strategies.
Key Features
1. Multi-Pair Analysis
Monitor up to 20 stock pairs simultaneously
Customizable number of pairs to display (1-20)
Pre-configured with popular NSE stock pairs across various sectors
2. Statistical Calculations
Correlation Analysis: Measures the strength of relationship between paired stocks
Z-Score Calculation: Identifies extreme deviations from the mean spread
Cointegration Score: Validates long-term equilibrium relationships
Dynamic Hedge Ratio: Calculates optimal position sizing between pairs
3. Trading Signals
Long Signal: When spread is oversold (Z-score ≤ -2.0)
Short Signal: When spread is overbought (Z-score ≥ 2.0)
Exit Signal: When spread returns to mean (Z-score ≤ 0.5)
Watch Status: Pairs requiring monitoring
4. Automated Alert System
Single comprehensive alert for all qualifying pairs
Customizable alert thresholds for correlation, Z-score, and cointegration
On-chart visual alerts with detailed information
Notification support via TradingView's alert system
5. Visual Display
Clean, color-coded table interface
Adjustable table position (9 positions available)
Highlighted trading opportunities
Real-time metric updates
Configuration Parameters
Screener Settings
Number of Pairs to Display: 1-20 pairs (default: 20)
Calculation Parameters
Parameter Default Range Description Correlation Lookback Period25220-500Historical period for correlation calculation Z-Score SMA Length205-100Moving average length for spread calculation Hedge Ratio Length205-100Period for hedge ratio smoothing Minimum Correlation0.70.5-1.0Threshold for pair validation
Alert Settings
Parameter Default Range Description Alert Correlation Threshold0.70.5-1.0Minimum correlation for alerts Alert Z-Score Threshold2.01.0-3.0Z-score trigger level Alert Cointegration Threshold90%80-99%Minimum cointegration percentage
Display Settings
Table Position: 9 position options (default: middle_center)
Table Background Color: Customizable
Highlight Opportunities: Toggle visual highlighting of trading signals
Pre-Configured Stock Pairs
The script includes 20 carefully selected NSE pairs across various sectors:
Financial Services
RELIANCE / ONGC
HDFCBANK / ICICIBANK
SBIN / PNB
KOTAKBANK / AXISBANK
BAJFINANCE / BAJAJFINSV
Information Technology
TCS / INFY
WIPRO / HCLTECH
TECHM / LTIM
Consumer Goods
ITC / HINDUNILVR
TITAN / TANLA
ASIANPAINT / BERGEPAINT
Telecommunications
BHARTIARTL / IDEA
Automotive
MARUTI / TATAMOTORS
Infrastructure & Industrials
LT / UBL
POWERGRID / NTPC
Pharmaceuticals
SUNPHARMA / CIPLA
DIVISLAB / DRREDDY
Materials
ULTRACEMCO / ACC
UPL / JSWSTEEL
Energy
ADANIENT / ADANIPOWER
🎨 Color-Coded Metrics
Correlation
🟢 Green: ≥ Minimum threshold (strong relationship)
🔴 Red: < Minimum threshold (weak relationship)
Z-Score
🔴 Red: |Z| ≥ 2.0 (extreme deviation - trading opportunity)
🟡 Yellow: 0.5 < |Z| < 2.0 (normal range - watch)
🟢 Green: |Z| ≤ 0.5 (mean reversion - exit signal)
Cointegration
🟢 Green: ≥ 70% (strong cointegration)
🟡 Yellow: 50-70% (moderate cointegration)
🔴 Red: < 50% (weak cointegration)
Status
🟢 Green: Long (buy spread)
🔴 Red: Short (sell spread)
🔵 Blue: Exit (close positions)
⚪ Gray: Watch (monitor)
Validation
🟢 Green: Pass (meets all criteria)
🔴 Red: Fail (doesn't meet criteria)
How It Works
1. Data Collection
The script fetches real-time closing prices for all 20 stock pairs from NSE.
2. Statistical Analysis
For each pair, the script calculates:
Log Returns: Natural logarithm of price changes
Correlation: Pearson correlation coefficient between returns
Hedge Ratio: Price ratio smoothed over specified period
Spread: Price difference adjusted by hedge ratio
Z-Score: Standardized spread deviation
3. Signal Generation
Based on Z-score thresholds:
Z ≥ 2.0: Short spread (short overvalued, long undervalued)
Z ≤ -2.0: Long spread (long overvalued, short undervalued)
|Z| ≤ 0.5: Exit positions (spread reverted to mean)
4. Validation
Pairs must meet criteria:
Correlation ≥ minimum threshold
Valid trading signal (entry or exit)
5. Alert Triggering
Alerts fire when pairs simultaneously meet:
Correlation ≥ alert threshold
|Z-score| ≥ alert threshold
Cointegration ≥ alert threshold
Alert System
The script features a single comprehensive alert that monitors all pairs:
Consolidated Notifications: One alert for all qualifying pairs
Detailed Information: Includes pair names, signal type, and key metrics
Visual Indicators: Red label on chart with complete details
Customizable Thresholds: Adjust sensitivity based on trading style
Alert Message Format
PAIR TRADING OPPORTUNITIES
Pair X: STOCK1/STOCK2
Signal: LONG/SHORT Spread
Z-Score: X.XX
Correlation: X.XXX
Cointegration: XX.X%
Trading Strategy Guide
Entry Rules
Long Spread (Z-score ≤ -2.0):
Buy Stock Y
Sell Stock X (in ratio of hedge ratio)
Short Spread (Z-score ≥ 2.0):
Sell Stock Y
Buy Stock X (in ratio of hedge ratio)
Exit Rules
Close positions when Z-score returns to ±0.5
Set stop-loss at Z-score ±3.0 (extreme deviations)
Risk Management
Only trade pairs with correlation ≥ 0.7
Prefer cointegration scores ≥ 90%
Monitor hedge ratio changes
Diversify across multiple pairs
Customization Options
Adding New Pairs
Simply modify the stock symbol inputs in the respective pair groups (Pair 1 through Pair 20).
Adjusting Sensitivity
Conservative: Increase Z-score threshold to 2.5-3.0
Aggressive: Decrease Z-score threshold to 1.5-2.0
Long-term: Increase lookback period to 500
Short-term: Decrease lookback period to 50-100
Visual Preferences
Change table position to suit your layout
Adjust background colors for better contrast
Toggle opportunity highlighting on/off
Technical Notes
Calculation Method
Uses logarithmic returns for correlation (better statistical properties)
Z-score normalized by standard deviation
Cointegration approximated using correlation strength
Hedge ratio smoothed using simple moving average
Performance Considerations
Calculations update on every bar close
Table displays only on the last bar
Alert checks occur at bar close
Maximum 500 labels supported (more than sufficient)
Limitations
Does not account for transaction costs
Assumes linear relationships between pairs
Historical correlation doesn't guarantee future behaviour
Requires sufficient liquidity in both stocks
Best Practices
Back test Thoroughly: Test parameters on historical data before live trading
Monitor Regularly: Check pairs daily for validation changes
Diversify: Trade multiple pairs to reduce risk
Stay Informed: Be aware of corporate actions, news affecting pairs
Adjust Parameters: Optimize for current market conditions
Use Stop-Losses: Protect against extreme divergences
Track Performance: Maintain trading journal for continuous improvement
Indicator Information
Version: Pine Script v5
Overlay: False (separate pane)
Max Labels: 500
Update Frequency: Every bar close
Compatible Timeframes: All (works best on daily or higher)
Getting Started
Add to Chart: Apply indicator to any NSE stock
Configure Pairs: Adjust stock symbols as needed
Set Parameters: Customize calculation and alert settings
Create Alert: Set up Trading View alert for notifications
Monitor: Watch the table for trading opportunities
Execute: Trade based on validated signals
📞Support & Updates
This script is designed for educational and research purposes. Always:
Conduct thorough back testing
Use proper risk management
Consider transaction costs
Consult with financial advisors
Trade responsibly
Disclaimer: This indicator is for educational purposes only. Past performance does not guarantee future results. Always conduct your own research and risk assessment before trading.
